
Filed by Galata Acquisition Corp.
Pursuant to Rule 425 under the Securities Act of 1933
and deemed filed pursuant to Rule 14a-12
under the Securities Exchange Act of 1934
Subject Company: Galata Acquisition Corp.
Commission File No.: 001-40588
Date: May 26, 2023
Marti Reports Solid Fourth Quarter 2022 Performance; Introduces Car-pooling Service Pilot
Istanbul, Turkey – May 26, 2023 - Marti Technologies Inc. (“Marti” or the “Company”), Turkey’s leading mobility app, today announced its financial results for the fourth quarter of 2022.
The Company delivered strong financial performance in the fourth quarter as net revenue increased by 84% to $6.3 million as compared to the same period in 2021, and average net revenue per ride increased by 31% compared to the same period in 2021 due to timely price increases in excess of depreciation of the Turkish Lira against the U.S. dollar.
Operating expenses as a share of net revenue increased due to the launch of sub-scale operations in new markets. In addition, the launch of Marti’s car-pooling service, including related marketing and personnel costs, contributed to a decrease in Adjusted EBITDA of $2.7 million to $(3.9) million in Q4’22.
Marti Founder and Chief Executive Officer Alper Oktem said: “We are proud to have launched our car-pooling service in the fourth quarter of 2022, which is our first four-wheeled service offering and a complement to our existing two-wheeled offerings. With the launch of our car-pooling service, Marti is now catering to a much larger customer base, in line with relative demand for four-wheeled vehicles.
This was a major investment and growth period for the company, and we’re grateful to our team members who stepped up and delivered a world class product to customers in a very short amount of time.”
New Car-Pooling Service Pilot
Going into the fourth quarter, Marti was the only mobility app in Turkey offering e-scooters, e-bikes, and e-mopeds. With the launch of its car-pooling service, Marti continues its role as the market leader in Turkey and is now able to offer a full range of mobility services to its customers through multiple transportation options based on destination distance, availability of public transportation, cost, and time of day.
2022 Full Year Financial and Operational Highlights
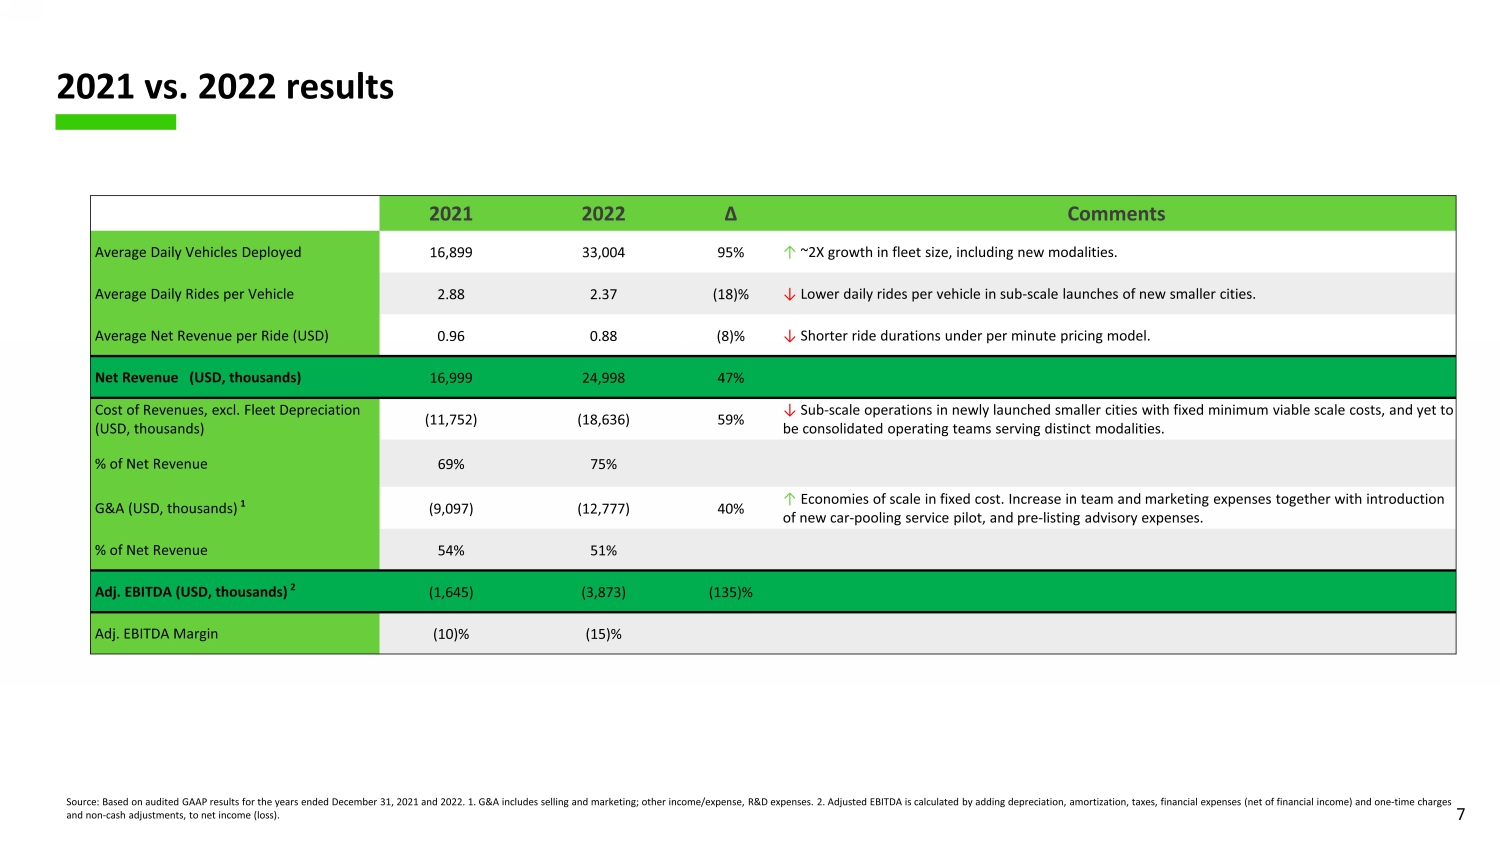
| · | Consolidated net revenue increased 47% to $25.0 million compared to 2021, as a result of fleet expansion and a 60% year-on-year increase in rides, which totaled over 28 million. |
| · | Operating expenses, excluding depreciation and amortization, increased by 59% compared to 2021 to $18.6 million, due primarily to higher personnel costs as a result of biannual minimum wage increases and the launch of sub-scale operations in new cities, several of which have yet to reach minimum viable scale. |
| · | General and administrative costs increased by 40% to $12.8 million compared to 2021 as team and marketing expenses increased primarily due to the introduction of our car-pooling service pilot. |
| · | Adjusted EBITDA decreased by 135% to $(3.9) million, and adjusted EBITDA margin decreased by 5% to (15)% when compared to 2021, primarily as a result of increased operational, general and administrative, and business combination advisory expenses. |
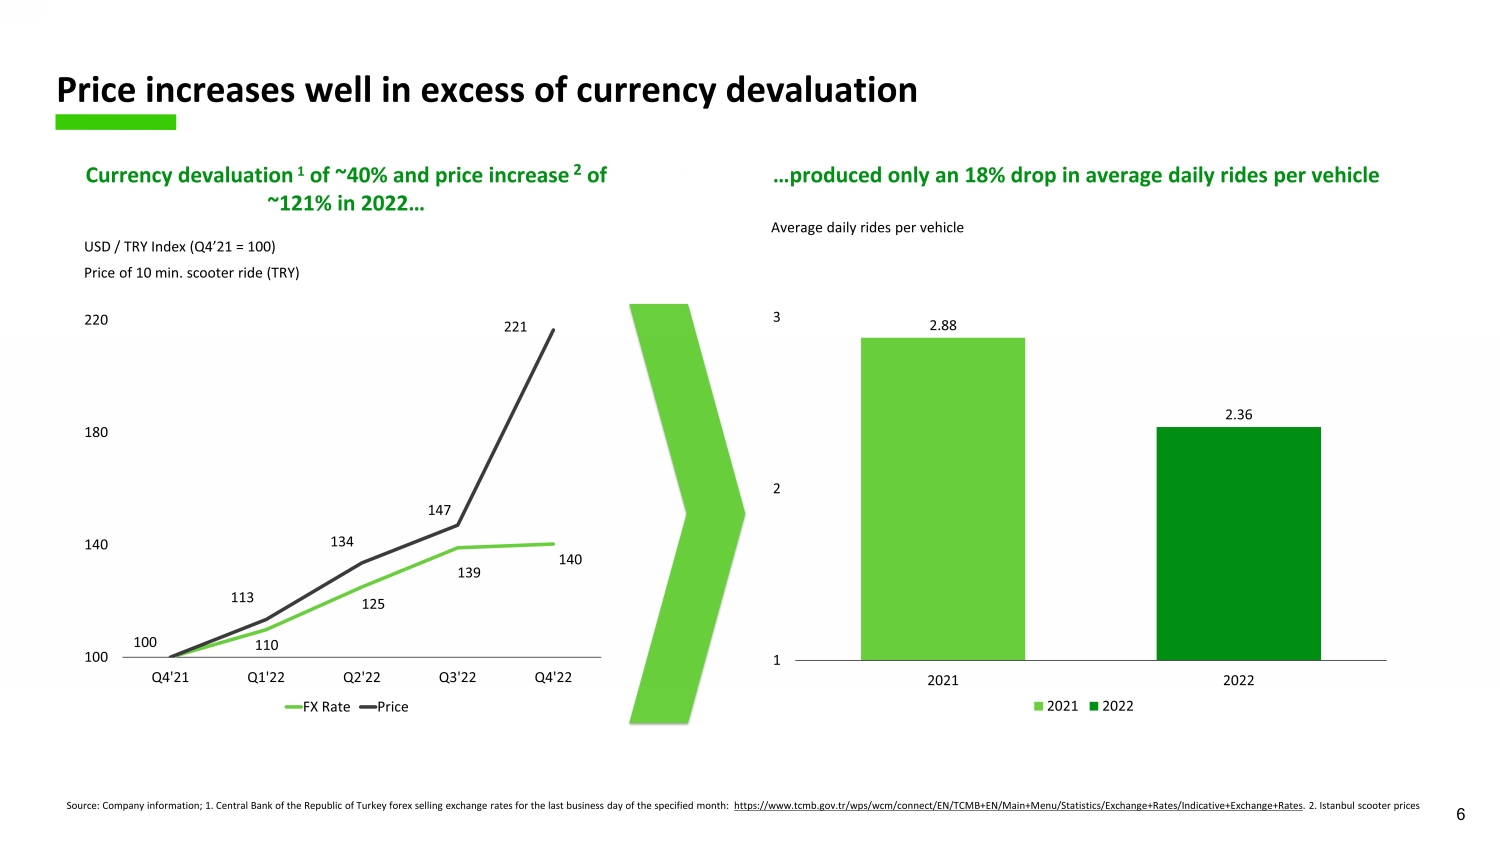
| · | Prices increased by 121% compared to 2021, significantly exceeding the 40% currency depreciation of the Turkish lira relative to the U.S. dollar during the same period. Average daily rides per vehicle decreased 18% compared to 2021. |
Fourth Quarter 2022 Financial and Operational Highlights
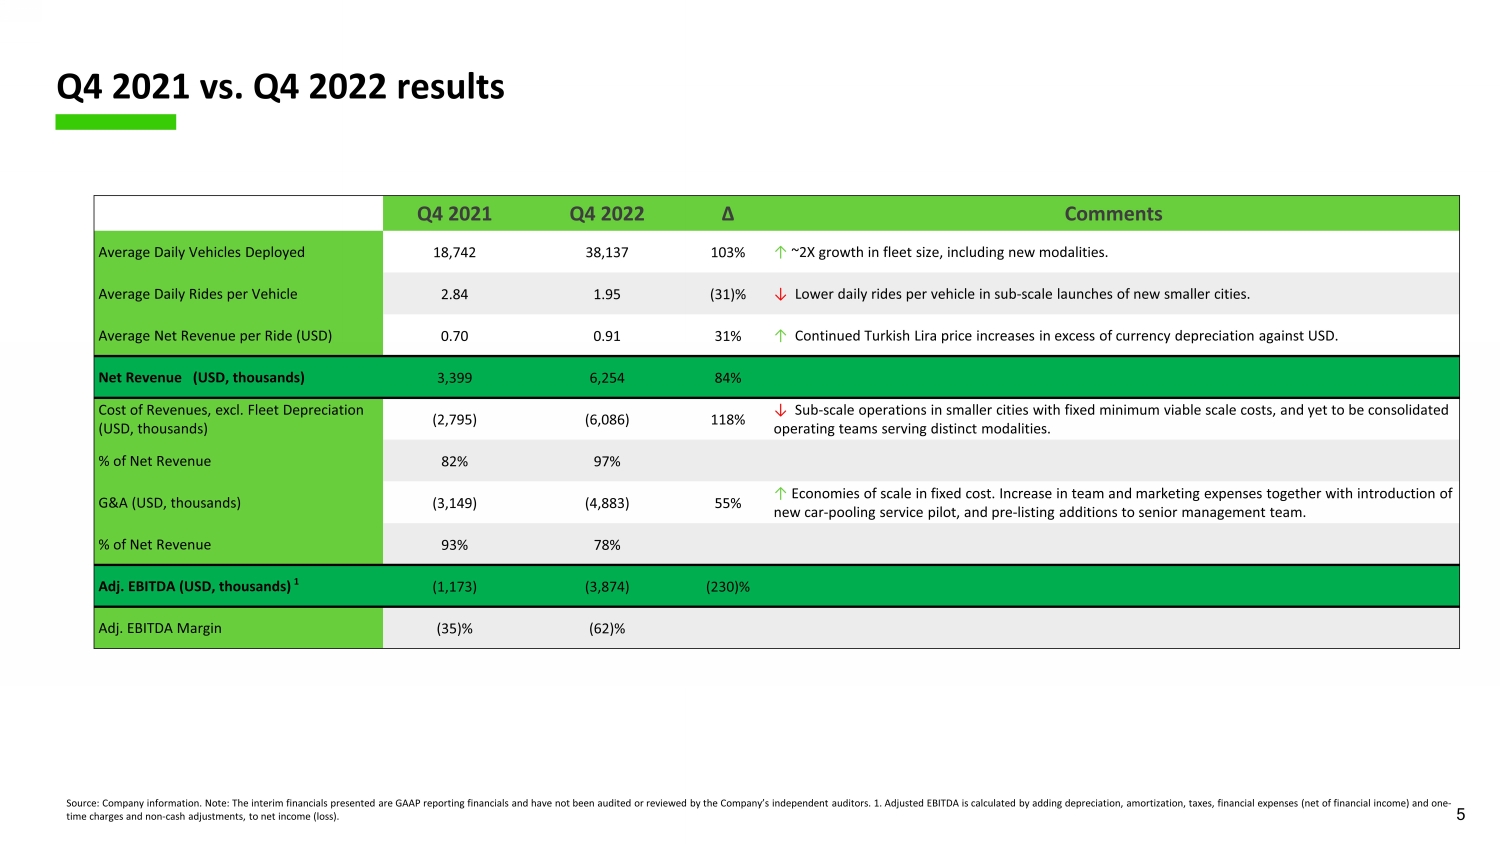
| · | Net revenue increased 84% to $6.3 million, compared to $3.4 million in Q4’21, as a result of fleet expansion and timely pricing actions in response to increased inflation and local currency devaluation. |
| · | Operating expenses, excluding depreciation and amortization, increased by 118% to $6.1 million, compared to $2.8 million in Q4’21, which is higher than our Q4’22 forecast of $4.8 million due to increased personnel costs related to the creation of distinct teams for each modality that have yet to be consolidated, and fixed minimum startup investment costs related to the launch of operations in new cities that we have yet to scale. |
| · | General and administrative expenses increased by 55% to $4.9 million in Q4’22, compared to $3.1 million in Q4’21, due to increased team and marketing expenses related to the launch of our car-pooling service pilot and additions to our senior management team. |
| · | Adjusted EBITDA decreased to $(3.9) million, with an adjusted EBITDA margin of (62)%, compared to $(1.2) million in Q4’21 due to increased operating expenses resulting from the introduction of our car-pooling service, increased advisory expenses and expansion of our senior management team. |
| · | Average daily vehicles deployed increased to 38.1 thousand compared to 18.7 thousand in Q4’21 as our fleet size more than doubled, outpacing an expected increase to 36.4 thousand Fleet availability increased primarily due to lower incidence of repair and maintenance requirements and increased efficiency of battery swapping. |
| · | Average daily rides per vehicle decreased by 31% compared to Q4’21 due to lower daily rides per vehicle in newly launched sub-scale cities. |
| · | Average net revenue per ride increased by 31% to $0.91, compared to $0.7 in Q4’21, primarily due to increased prices in excess of inflation and currency depreciation. |
| · | Monthly fleet theft and vandalism rates remained below 0.1%. |
| · | We continued to build out our management team to support commercial growth opportunities by adding 47 new employees at our headquarters, including department heads for our Marketing and Operations teams. As of December 31, 2022, we had a 213-person team at our headquarters and 863 field team members. We continue to prioritize investments in talent, including senior management roles. |
Financial Information; Non-GAAP Financial Measures
The financial information and data contained in this Press Release is unaudited and does not conform to Regulation S-X promulgated under the U.S. Securities Act of 1933, as amended. Accordingly, such information and data may not be included in, may be adjusted in or may be presented differently in, any registration statement or proxy statement/prospectus to be filed by Galata with the U.S. Securities and Exchange Commission.
This financial information and data contained herein are not presented in accordance with generally accepted accounting principles of the United States (“GAAP”) including, but not limited to, adjusted EBITDA and certain ratios and other metrics derived therefrom. We define these metrics as follows:
Adjusted EBITDA as depreciation, amortization, taxes, financial expenses (net of financial income) and one-time charges and non-cash adjustments, plus net income (loss). The one-time charges and non-cash adjustments are mainly comprised of customs tax provision expenses resulting from the one-time amendment of customs duties, period adjustments for the founders’ salary which resulted from a one-time lump sum deferred payment made to the founders, and lawsuit provision expense which the Company does not consider the provision to be reflective of its normal cash operations.
Adjusted EBITDA margin as adjusted EBITDA/net revenue.
These non-GAAP financial measures are not measures of financial performance in accordance with GAAP and may exclude items that are significant in understanding and assessing the Company’s financial results. Therefore, these measures should not be considered in isolation or as an alternative to net income, cash flows from operations or other measures of profitability, liquidity or performance under GAAP. You should be aware that the Company’s presentation of these measures may not be comparable to similarly titled measures used by other companies. The Company believes these non-GAAP measures of financial results provide useful information for management and investors regarding certain financial and business trends relating to the Company’s financial condition and results of operations. The Company believes the use of these non-GAAP financial measures provides an additional tool for investors to use in evaluating ongoing operating results and trends and in comparing the Company’s financial measures with other similar companies, many of which present similar non-GAAP financial measures to investors. These non-GAAP financial measures are subject to inherent limitations as they reflect the exercise of judgments by management about which expense and income are excluded or included in determining these non-GAAP financial measures and accordingly, should always be considered as supplemental financial results to those calculated in accordance with GAAP.
This financial information and data contained herein also includes certain projections of non-GAAP financial measures. Due to the high variability and difficulty in making accurate forecasts and projections of some of the information excluded from these projected measures, together with some of the excluded information not being ascertainable or accessible, the Company is unable to quantify certain amounts that would be required to be included in the most directly comparable GAAP financial measures without unreasonable effort. Consequently, no disclosure of estimated comparable GAAP measures is included and no reconciliation of the forward-looking non-GAAP financial measures is included.
About Marti
Marti launched operations in 2019 with the goal of offering tech-enabled urban transportation services to riders across Turkey. We operate the country’s largest fleet of e-mopeds, e-bikes, and e-scooters, serviced by proprietary software systems and IOT infrastructure, and we are the number one travel app in Turkey across iOS and Android app stores. We offer environmentally sustainable transportation services, that are currently delivered via fully electric vehicles, to our riders in an economically sustainable manner. For more information visit ir.marti.tech.
Important Additional Information and Where to Find It
In connection with the proposed business combination, Galata Acquisition Corp. (“Galata”) and Marti Technologies, Inc. (“Marti”) have filed a registration statement on Form F-4 (as amended, the “Registration Statement”) with the Securities and Exchange Commission, which includes a proxy statement/prospectus and certain other related documents. The Registration Statement is not yet effective.
INVESTORS AND SECURITY HOLDERS ARE URGED TO READ THE REGISTRATION STATEMENT, PROXY STATEMENT/PROSPECTUS, ANY AMENDMENTS OR SUPPLEMENTS THERETO AND ANY OTHER RELEVANT DOCUMENTS TO BE FILED WITH THE SEC IN CONNECTION WITH THE PROPOSED BUSINESS COMBINATION CAREFULLY AND IN THEIR ENTIRETY, WHEN THEY BECOME AVAILABLE, BECAUSE THEY WILL CONTAIN IMPORTANT INFORMATION ABOUT GALATA, MARTI AND THE PROPOSED BUSINESS COMBINATION.
When available, the definitive proxy statement/prospectus and other relevant materials for the proposed business combination will be mailed to stockholders of Galata as of a record date to be established for voting on the proposed business combination. Security holders and investors will also be able to obtain copies of the Registration Statement, proxy statement/prospectus and other documents filed with the SEC that will be incorporated by reference therein, without charge, once available, at the SEC’s website at www.sec.gov. Documents filed with the SEC by Galata will also be available free of charge by accessing Galata’s website at https://www.galatacorp.net, or, alternatively, by directing a request by mail to Galata at 2001 S Street NW, Suite 320, Washington, DC 20009.
Participants in the Solicitation
Galata and Marti and certain of their respective directors and executive officers and other members of management and employees may be deemed to be participants in the solicitation of proxies with respect to the proposed business combination under the rules of the SEC. Information about Galata’s directors and executive officers is contained in Galata’s Annual Report on Form 10-K for the fiscal year ended December 31, 2022, as filed with the SEC pursuant to Section 13 of the Securities Exchange Act of 1934, as amended, on March 31, 2023, which is available free of charge at the SEC’s website at www.sec.gov or by directing a request to Galata at 2001 S Street NW, Suite 320, Washington, DC 20009. Additional information regarding the participants in the proxy solicitation and a description of their direct and indirect interests, by security holdings or otherwise, will be contained in the proxy statement/prospectus and other relevant materials to be filed with the SEC regarding the proposed business combination when they become available. Investors should read the proxy statement/prospectus carefully when it becomes available before making any voting or investment decisions. You may obtain free copies of these documents from the sources indicated above.
No Offer or Solicitation
This communication shall not constitute an offer to sell or the solicitation of a proxy, consent, or authorization with respect to or an offer to buy any securities in respect of the proposed business combination, nor shall there be any sale of securities in any jurisdiction in which such offer, solicitation or sale would be unlawful prior to registration or qualification under the securities laws of any such jurisdiction. No offering of securities shall be made except by means of a prospectus meeting the requirements of Section 10 of the U.S. Securities Act of 1933, as amended, or an exemption therefrom.
Cautionary Statement Regarding Forward-Looking Information
This communication contains statements that are not based on historical fact and are “forward-looking statements’’ within the meaning of the “safe harbor” provisions of the Private Securities Litigation Reform Act of 1995. For example, statements about the expected timing of the completion of the proposed business combination, the benefits of the proposed business combination, the competitive environment, and the expected future performance and market opportunities of Marti are forward-looking statements. In some cases, you can identify forward looking statements by terminology such as, or which contain the words “will,” “aim,” “anticipate,” “believe,” “continue,” “could,” “estimate,” “expect,” “forecast,” “future,” “intend,” “may,” “plan,” “possible,” “predict,” “project,” “seek,” “should,” “target,” “will,” “would” and variations of these words or similar expressions. Such forward-looking statements are subject to risks, uncertainties and other factors. Actual results may differ materially from the expectations expressed or implied in the forward-looking statements as a result of known and unknown risks and uncertainties.
These forward-looking statements are based on estimates and assumptions that, while considered reasonable by Marti and its management are inherently uncertain and are subject to a number of risks and assumptions. These statements are not guarantees of future performance and are subject to risks, uncertainties and other factors, some of which are beyond Marti’s control, are difficult to predict, and could cause actual results to differ materially from those expressed or forecasted in the forward-looking statements. Known risks and uncertainties include but are not limited to: (1) the occurrence of any event, change or other circumstances that could give rise to the termination of the business combination agreement; (2) the outcome of any legal proceedings that may be instituted against Marti, Galata, the combined company or others following the announcement of the proposed business combination; (3) the inability to complete the proposed business combination in a timely manner or at all (including due to the failure to obtain approval of the stockholders of Galata or to satisfy other conditions to closing); (4) changes to the proposed structure of the proposed business combination that may be required or appropriate as a result of applicable laws or regulations; (5) the ability to meet applicable stock exchange listing standards at or following the consummation of the proposed business combination; (6) the risk that the proposed business combination disrupts current plans and operations of Marti as a result of the announcement and consummation of the proposed business combination; (7) the ability to recognize the anticipated benefits of the proposed business combination, which may be affected by, among other things, competition, the ability of the combined company to grow and manage growth profitably, maintain relationships with customers and suppliers and retain its management and key employees; (8) costs related to the proposed business combination, including the amount of cash available following any redemptions by Galata stockholders; (9) changes in applicable laws or regulations; (10) the possibility that Marti or the combined company may be adversely affected by other economic, business and/or competitive factors; (11) risks relating to Marti’s operating history and the mobile transportation industry; (12) risks associated with doing business in an emerging market; (13) risks relating to Marti’s dependence on and use of certain intellectual property and technology; and (14) other risks and uncertainties set forth in the Registration Statement to be filed by Galata with the SEC in connection with the proposed business combination. The foregoing list of important factors is not exhaustive and you should carefully consider the other risks and uncertainties described in the “Risk Factors” section of Galata’s Annual Report on Form 10-K, Quarterly Reports on Form 10-Q and other documents filed by Galata from time to time with the SEC.
Nothing herein should be regarded as a representation by any person that the forward-looking statements set forth herein will be achieved or that any of the contemplated results of such forward-looking statements will be achieved. You should not place undue reliance on forward-looking statements, which speak only as of the date they are made. Except as may be required by applicable law, neither Marti nor Galata undertakes any duty to update or revise any forward-looking statements whether as a result of new information, new events, future events or circumstances, or otherwise.
Investor Relations Contact:
Ozge Arcasoy
Marti Technologies Inc.
ir.marti.tech
investor.relations@marti.tech
Interim Financials:
| Q4 2021 | Q4 2022 | ∆ | 2021 | 2022 | ∆ | |||||||||||||||||||
| Average Daily Vehicles Deployed | 18,742 | 38,137 | 103 | % | 16,899 | 33,004 | 95 | % | ||||||||||||||||
| Average Daily Rides per Vehicle | 2.84 | 1.95 | (31 | )% | 2.88 | 2.37 | (18 | )% | ||||||||||||||||
| Average Net Revenue per Ride (USD) | 0.70 | 0.91 | 31 | % | 0.96 | 0.88 | (8 | )% | ||||||||||||||||
| Net Revenue (USD, thousands) | 3,399 | 6,254 | 84 | % | 16,999 | 24,998 | 47 | % | ||||||||||||||||
| Operating Costs, excl. D&A (USD, thousands) | (2,795 | ) | (6,086 | ) | 118 | % | (11,752 | ) | (18,636 | ) | 59 | % | ||||||||||||
| % of Net Revenue | 82 | % | 97 | % | 69 | % | 75 | % | ||||||||||||||||
| G&A (USD, thousands) | (3,149 | ) | (4,883 | ) | 55 | % | (9,097 | ) | (12,777 | ) | 40 | % | ||||||||||||
| % of Net Revenue | 93 | % | 78 | % | 54 | % | 51 | % | ||||||||||||||||
| Adj. EBITDA (USD, thousands) 1 | (1,173 | ) | (3,874 | ) | 230 | % | (1,645 | ) | (3,873 | ) | 135 | % | ||||||||||||
| Adj. EBITDA Margin | (35 | )% | (62 | )% | (10 | )% | (15 | )% | ||||||||||||||||
Adjusted EBITDA reconciliation:
| (USD, thousands) | Q4 2021 | Q4 2022 | 2021 | 2022 | ||||||||||||
| Net loss | (8,512 | ) | (4,947 | ) | (14,472 | ) | (14,426 | ) | ||||||||
| Depreciation and Amortization | 1,538 | 2,258 | 5,743 | 9,097 | ||||||||||||
| Income tax expense | 888 | - | 888 | - | ||||||||||||
| Financial income | (80 | ) | (2,404 | ) | (180 | ) | (2,567 | ) | ||||||||
| Financial expense | 3,832 | 579 | 4,712 | 1,932 | ||||||||||||
| EBITDA | (2,344 | ) | (4,513 | ) | (3,580 | ) | (5,784 | ) | ||||||||
| One-off adjustments | 456 | 263 | 1,048 | 78 | ||||||||||||
| Customs tax provision expense | - | 263 | 592 | 78 | ||||||||||||
| Founders’ salary adjustment | 218 | - | 218 | - | ||||||||||||
| Other | 238 | - | 238 | - | ||||||||||||
| Non-cash adjustments | 716 | 376 | 887 | 1,833 | ||||||||||||
| Stock based compensation expense accrual | 680 | 403 | 852 | 1,658 | ||||||||||||
| Lawsuit provision expense | 35 | (27 | ) | 35 | 175 | |||||||||||
| Adj. EBITDA | (1,173 | ) | (3,874 | ) | (1,645 | ) | (3,873 | ) | ||||||||
TURKEY’S LEADING MOBILITY APP Q4 2022 INVESTOR PRESENTATION
About this Presentation This confidential presentation (this “Presentation”) is for informational purposes only to assist interested parties in making their own evaluation with respect to an investment in connection with a possible transaction (the “Business Combination”) involving Marti Technologies Inc . (“Marti” or the “Company”) and Galata Acquisition Corp . (“Galata” or “SPAC”), and for no other purpose . The information contained herein does not purport to be all - inclusive and none of Galata, the Company or their respective representatives or affiliates makes any representation or warranty, express or implied, as to the accuracy, completeness or reliability of the information contained in this Presentation . This Presentation and any oral statements made in connection with this Presentation do not constitute (i) a solicitation of a proxy, consent or authorization with respect to any securities or in respect of the proposed Business Combination or (ii) an offer to sell, a solicitation of an offer to buy or a recommendation to purchase any securities . No such offering of securities shall be made except by means of a prospectus meeting the requirements of section 10 of the Securities Act of 1933 , as amended (the “Securities Act”), or an exemption therefrom . You should not construe the contents of this Presentation as legal, tax, accounting, investment or other advice or a recommendation . You should consult your own counsel and tax and financial advisors as to legal and related matters concerning the matters described herein, and, by accepting this Presentation, you confirm that you are not relying upon the information contained herein to make any decision . The distribution of this Presentation may also be restricted by law and persons into whose possession this Presentation comes should inform themselves about, and observe, any such restrictions . The recipient acknowledges that it is (a) aware that the United States securities laws prohibit any person who has material, non - public information concerning a company from purchasing or selling securities of such company or from communicating such information to any other person under circumstances in which it is reasonably foreseeable that such person is likely to purchase or sell such securities, and (b) familiar with the Securities Exchange Act of 1934 , as amended, and the rules and regulations promulgated thereunder (collectively, the "Exchange Act"), and that the recipient will neither use, nor cause any third party to use, this Presentation or any information contained herein in contravention of the Exchange Act, including, without limitation, Rule 10 b - 5 thereunder . This Presentation and information contained herein constitutes confidential information and is provided to you on the condition that you agree that you will hold it in strict confidence and not reproduce, disclose, forward or distribute it in whole or in part without the prior written consent of SPAC and the Company and is intended for the recipient hereof only . By accepting this Presentation, the recipient agrees (a) to maintain the confidentiality of all information that is contained in this Presentation and not already in the public domain and (b) to return or destroy all copies of this Presentation or portions thereof in its possession upon request . This Presentation is being distributed to selected recipients only and is not intended for distribution to, or use by, any person or entity in any jurisdiction or country where such distribution or use would be contrary to local law or regulation . Neither this Presentation nor any part of it may be taken or transmitted into the United States or published, released, disclosed or distributed, directly or indirectly, in the United States, as that term is defined in the Securities Act, except to a limited number of qualified institutional buyers, as defined in Rule 144 A under the Securities Act, or institutional “accredited investors” within the meaning of Regulation D under the Securities Act . Forward Looking Statements Certain statements in this Presentation may be considered forward - looking statements within the meaning of the U . S . federal securities laws with respect to the proposed Business Combination . Forward - looking statements generally relate to future events, such as the benefits of the Business Combination or the anticipated timing of the Business Combination , or SPAC or the Company’s future financial or operating performance . For example, statements regarding anticipated growth in the industry in which the Company operates and anticipated growth in demand for the Company’s products, projections of the Company’s future financial results, possible growth opportunities for the Company and other metrics are forward - looking statements . In some cases, you can identify forward - looking statements by terminology such as “pro forma,” “may,” “should,” “could,” “might,” “plan,” “possible,” “project,” “strive,” “budget,” “forecast,” “expect,” “intend,” “will,” “estimate,” “anticipate,” “believe,” “predict,” “potential” and “continue” or the negatives of these terms or variations of them or similar terminology . Such forward - looking statements are subject to risks, uncertainties and other factors which could cause actual results to differ materially from those expressed or implied by such forward - looking statements . These forward - looking statements are based upon estimates and assumptions that, while considered reasonable by SPAC, the Company and their respective management, as the case may be, are inherently uncertain . Factors that may cause actual results to differ materially from current expectations include, but are not limited to : competition ; the ability of the company to grow and manage growth, maintain relationships with consumers, suppliers and strategic partners and retain its management and key employees ; costs related to the Business Combination ; changes in applicable laws or regulations ; the possibility that the Company may be adversely affected by other economic, business or competitive factors ; the Company’s estimates of expenses and profitability ; the evolution of the markets in which the Company competes ; the ability of the Company to implement its strategic initiatives and continue to innovate its existing products ; the ability of the Company to defend its intellectual property ; and the impact of the COVID - 19 pandemic on the Company’s business . Nothing in this Presentation should be regarded as a representation by any person that the forward - looking statements set forth herein will be achieved or that any of the contemplated results of such forward - looking statements will be achieved . You should not place undue reliance on forward - looking statements, which speak only as of the date they are made . Neither SPAC nor the Company undertakes any duty to update or revise these forward - looking statements . , You should consult the risk factors included in SPAC’s public filings with the SEC, including the “Risk Factors” section in the registration statement on Form F - 4 and the proxy statement included therein ( as amended , the “Registration Statement”) that SPAC filed relating to the proposed Business Combination and the “Risk Factors” section of other documents that SPAC files with the SEC from time to time, for additional information regarding risks and uncertainties related to the potential Business Combination and which could cause actual future events to differ materially from the forward - looking statements in this Presentation . Forward - looking statements speak only as of the date they are made . Readers are cautioned not to put undue reliance on forward - looking statements, and SPAC and Marti assume no obligation and do not intend to update or revise these forward - looking statements, whether as a result of new information, future events or otherwise . Disclaimers 2
Use of Projections This Presentation contains financial forecasts for the Company with respect to certain financial results for the Company’s fiscal year 2023 . The Company’s independent auditors have not audited, studied, reviewed, compiled or performed any procedures with respect to the projections for the purpose of their inclusion in this Presentation, and accordingly, they did not express an opinion or provide any other form of assurance with respect thereto for the purpose of this Presentation . These projections are forward - looking statements and should not be relied upon as being necessarily indicative of future results . In this Presentation, certain of the above - mentioned projected information has been provided for purposes of providing comparisons with historical data . The assumptions and estimates underlying the prospective financial information are inherently uncertain and are subject to a wide variety of significant business, economic, competitive and other risks and uncertainties that could cause actual results to differ materially from those contained in the prospective financial information . Accordingly, there can be no assurance that the prospective results are indicative of the future performance of the Company or that actual results will not differ materially from those presented in the prospective financial information . Inclusion of the prospective financial information in this Presentation should not be regarded as a representation by any person that the results contained in the prospective financial information will be achieved . The performance projections and estimates are subject to the ongoing COVID - 19 pandemic, and have the potential to be revised to take into account further adverse effects of the COVID - 19 pandemic on the future performance of SPAC and Marti . Projected financial results and estimates are based on an assumption that public health, economic, market and other conditions will improve ; however, there can be no assurance that such conditions will improve within the time period or to the extent estimated by SPAC or Marti . The full impact of the COVID - 19 pandemic on future performance is particularly uncertain and difficult to predict ; therefore actual results may vary materially and adversely from the projections included herein . Financial Information ; Non - GAAP Measures The financial information for the three months ended December 31 , 2021 and 2022 and data contained in this Presentation is unaudited and does not conform to Regulation S - X promulgated under the Securities Act . Such information and data may not be included in, may be adjusted in or may be presented differently in, the registration statement on Form F - 4 filed by Galata relating to the Business Combination and the proxy statement/prospectus contained therein . This Presentation also includes certain financial measures not presented in accordance with generally accepted accounting principles of the United States (“GAAP”) including, but not limited to, Adjusted EBITDA and certain ratios and other metrics derived therefrom . The Company defines Adjusted EBITDA as depreciation , amortization , taxes , financial expenses (net of financial income ) and one - time charges and non - cash adjustments , plus net income ( loss ) . These non - GAAP financial measures are not measures of financial performance in accordance with GAAP and may exclude items that are significant in understanding and assessing the Company’s financial results . Therefore, these measures should not be considered in isolation or as an alternative to net income, cash flows from operations or other measures of profitability, liquidity or performance under GAAP . You should be aware that the Company’s presentation of these measures may not be comparable to similarly - titled measures used by other companies . The Company believes these non - GAAP measures of financial results provide useful information for management and investors regarding certain financial and business trends relating to the Company’s financial condition and results of operations . The Company believes the use of these non - GAAP financial measures provides an additional tool for investors to use in evaluating ongoing operating results and trends and in comparing the Company’s financial measures with other similar companies, many of which present similar non - GAAP financial measures to investors . These non - GAAP financial measures are subject to inherent limitations as they reflect the exercise of judgments by management about which expense and income are excluded or included in determining these non - GAAP financial measures . This Presentation also includes certain projections of non - GAAP financial measures . Due to the high variability and difficulty in making accurate forecasts and projections of some of the information excluded from these projected measures, together with some of the excluded information not being ascertainable or accessible, the Company is unable to quantify certain amounts that would be required to be included in the most directly comparable GAAP financial measures without unreasonable effort . Consequently, no disclosure of estimated comparable GAAP measures is included and no reconciliation of the forward - looking non - GAAP financial measures is included . Industry and Market Data In this Presentation, SPAC and the Company rely on and refer to certain information and statistics obtained from third - party sources which SPAC and the Company believe to be reliable . While SPAC and the Company believe such third - party information is reliable, there can be no assurance as to the accuracy or completeness of the indicated information, and the Company has not independently verified the accuracy or completeness of any such information . Trademarks This Presentation contains trademarks, service marks, trade names and copyrights of other companies, which are the property of their respective owners . The Company’s use thereof does not imply an affiliation with, or endorsement by, the owners of such trademarks, service marks, trade names and copyrights . Solely for convenience, some of the trademarks, service marks, trade names and copyrights referred to in this Presentation may be listed without the TM, SM © or ® symbols, but the Company will assert, to the fullest extent under applicable law, the rights of the applicable owners to these trademarks, service marks, trade names and copyrights . There is no guarantee that either SPAC or the Company will work, or continue to work, with any of the firms or businesses whose logos are included herein in the future . Disclaimers (cont’d) 3
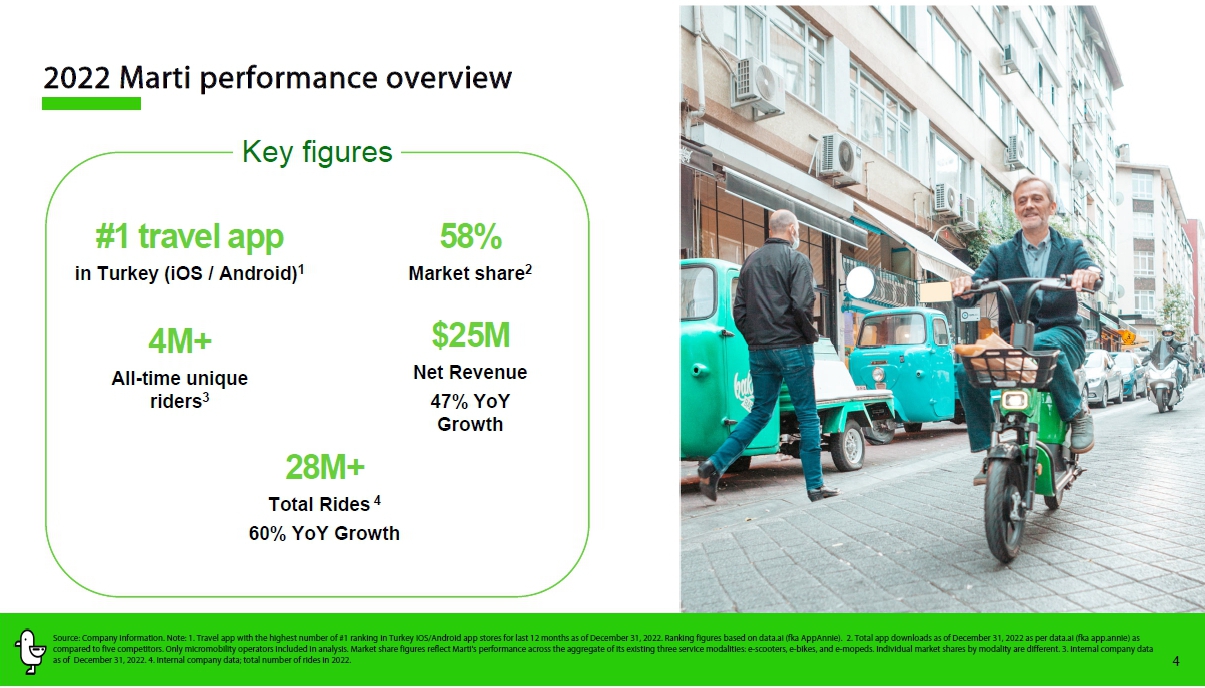
4 2022 Marti performance overview Key figures #1 travel app in Turkey (iOS / Android) 1 4 M + All - time u nique riders 3 28M+ Total Rides 4 60% YoY Growth $ 25M Net Revenue 47% YoY Growth 58 % Market share 2 Source: Company information. Note: 1. Travel app with the highest number of #1 ranking in Turkey iOS/Android app stores for l ast 12 months as of December 3 1 , 2022. Ranking figures based on data.ai ( fka AppAnnie ). 2. Total app downloads as of December 31 , 2022 as per data.ai ( fka app.annie ) as compared to five competitors. Only micromobility operators included in analysis. Market share figures reflect Marti's performance across the aggregate of its existing three s er vice modalities: e - scooters, e - bikes, and e - mopeds. Individual market shares by modality are different. 3. Internal company data as of December 31, 2022 . 4. Internal company data; total number of rides in 2022.
5 Q 4 2021 Q 4 202 2 ∆ Comments Average Daily Vehicles Deployed 18,742 38,137 103% ↑ ~ 2 X growth in fleet size, including new modalities . Average Daily Rides per Vehicle 2.84 1.95 (31)% ↓ Lower daily rides per vehicle in sub - scale launches of new smaller cities. Average Net Revenue per Ride (USD) 0.70 0.91 31% ↑ Continued Turkish Lira price increases in excess of currency depreciation against USD. Net Revenue (USD, thousands ) 3,399 6,254 84% Cost of Revenues , excl. Fleet Depreciation (USD, thousands ) (2,795) (6,086) 118% ↓ Sub - scale operations in smaller cities with fixed minimum viable scale costs, and yet to be consolidated operating teams serving distinct modalities. % of Net Revenue 82% 97% G&A (USD, thousands ) (3,149) (4,883) 55% ↑ Economies of scale in fixed cost . Increase in team and marketing expenses together with introduction of new car - pooling service pilot, and pre - listing additions to senior management team . % of Net Revenue 93% 78% Adj. EBITDA (USD, thousands ) 1 (1,173) (3,874) (230)% Adj. EBITDA Margin (35)% (62)% Q 4 202 1 vs. Q 4 202 2 results Source: Company information. Note : The interim financials presented are GAAP reporting financials and have not been audited or reviewed by the Company’s independent auditors . 1. Adjusted EBITDA is calculated by adding depreciation, amortization, taxes, financial expenses (net of financial income) and o ne - time charges and non - cash adjustments, to net income (loss) .
6 Price increase s well in excess of currency devaluation Currency devaluation 1 of ~ 40 % and price increase 2 of ~ 121 % in 2022… USD / TRY Index ( Q4’21 = 100) … produced only an 18% drop in average daily rides per vehicle Source: Company information ; 1. Central Bank of the Republic of Turkey forex selling exchange rates for the last business day of the specified month : https://www.tcmb.gov.tr/wps/wcm/connect/EN/TCMB+EN/Main+Menu/Statistics/Exchange+Rates/Indicative+Exchange+Rates . 2. Istanbul scooter prices 110 125 139 140 100 113 134 147 221 100 140 180 220 Q4'21 Q1'22 Q2'22 Q3'22 Q4'22 FX Rate Price Price of 10 min. scooter ride (TRY) Average daily rides per vehicle 2.88 2.36 1 2 3 2021 2022 2021 2022
7 2021 2022 ∆ Comments Average Daily Vehicles Deployed 16,899 33,004 95% ↑ ~ 2 X growth in fleet size, including new modalities . Average Daily Rides per Vehicle 2.88 2.37 (18)% ↓ Lower daily rides per vehicle in sub - scale launches of new smaller cities. Average Net Revenue per Ride (USD) 0.96 0.88 (8)% ↓ Shorter ride durations under per minute pricing model. Net Revenue (USD, thousands ) 16,999 24,998 47% Cost of Revenues , excl. Fleet Depreciation (USD, thousands ) (11,752) (18,636) 59% ↓ Sub - scale operations in newly launched smaller cities with fixed minimum viable scale costs, and yet to be consolidated operating teams serving distinct modalities. % of Net Revenue 69% 75% G&A (USD, thousands ) 1 (9,097) (12,777) 40% ↑ Economies of scale in fixed cost . Increase in team and marketing expenses together with introduction of new car - pooling service pilot, and pre - listing advisory expenses . % of Net Revenue 54% 51% Adj. EBITDA (USD, thousands ) 2 (1,645) (3,873) (135)% Adj. EBITDA Margin (10)% (15)% 202 1 vs. 202 2 results Source: Based on audited GAAP results for the years ended December 31, 2021 and 2022 . 1. G&A includes selling and marketing; other income / expense , R&D expenses . 2. Adjusted EBITDA is calculated by adding depreciation, amortization, taxes, financial expenses (net of financial income) and o ne - time charges and non - cash adjustments, to net income (loss) .
8 2022 E 202 2 A ∆ Comments Average Daily Vehicles Deployed 32,434 33,004 2% ↑ Higher share of vehicles available for rent in the field due to lower incidence of repair and maintenance , and more efficient battery swapping . Average Daily Rides per Vehicle 2.38 2.37 - Parallel to forecast . Average Net Revenue per Ride (USD) 0.88 0.88 - Parallel to forecast . Net Revenue (USD, thousands ) 24,683 24,998 1% Cost of Revenues , excl. Fleet Depreciation (USD, thousands ) (16,444) (18,636) 13% ↓ Sub - scale operations in newly launched smaller cities with fixed minimum viable scale costs, and yet to be consolidated operating teams serving distinct modalities. % of Net Revenue 67% 75% G&A (USD, thousands ) 1 (9,441) (12,777) 35% ↓ Increase in team and marketing expenses together with introduction of new car - pooling service pilot. Pre - listing additions to senior management team and advisory expenses. % of Net Revenue 38% 51% Adj. EBITDA (USD, thousands ) 2 (804) (3,873) (382)% Adj. EBITDA Margin (3)% (15)% B usiness plan projections vs Actual 2022 Source: Business plan projections are non - GAAP management reporting financials and have not been audited or reviewed by the Company’s independent auditors . 2022 actual results are b ased on audited GAAP results for the year ended December 31, 2022 . 1. G&A includes selling and marketing; other income / expense and R&D exppenses . 2 Adjusted EBITDA is calculated by adding depreciation, amortization, taxes, financial expenses (net of financial income) and o ne - time charges and non - cash adjustments, to net income (loss) .
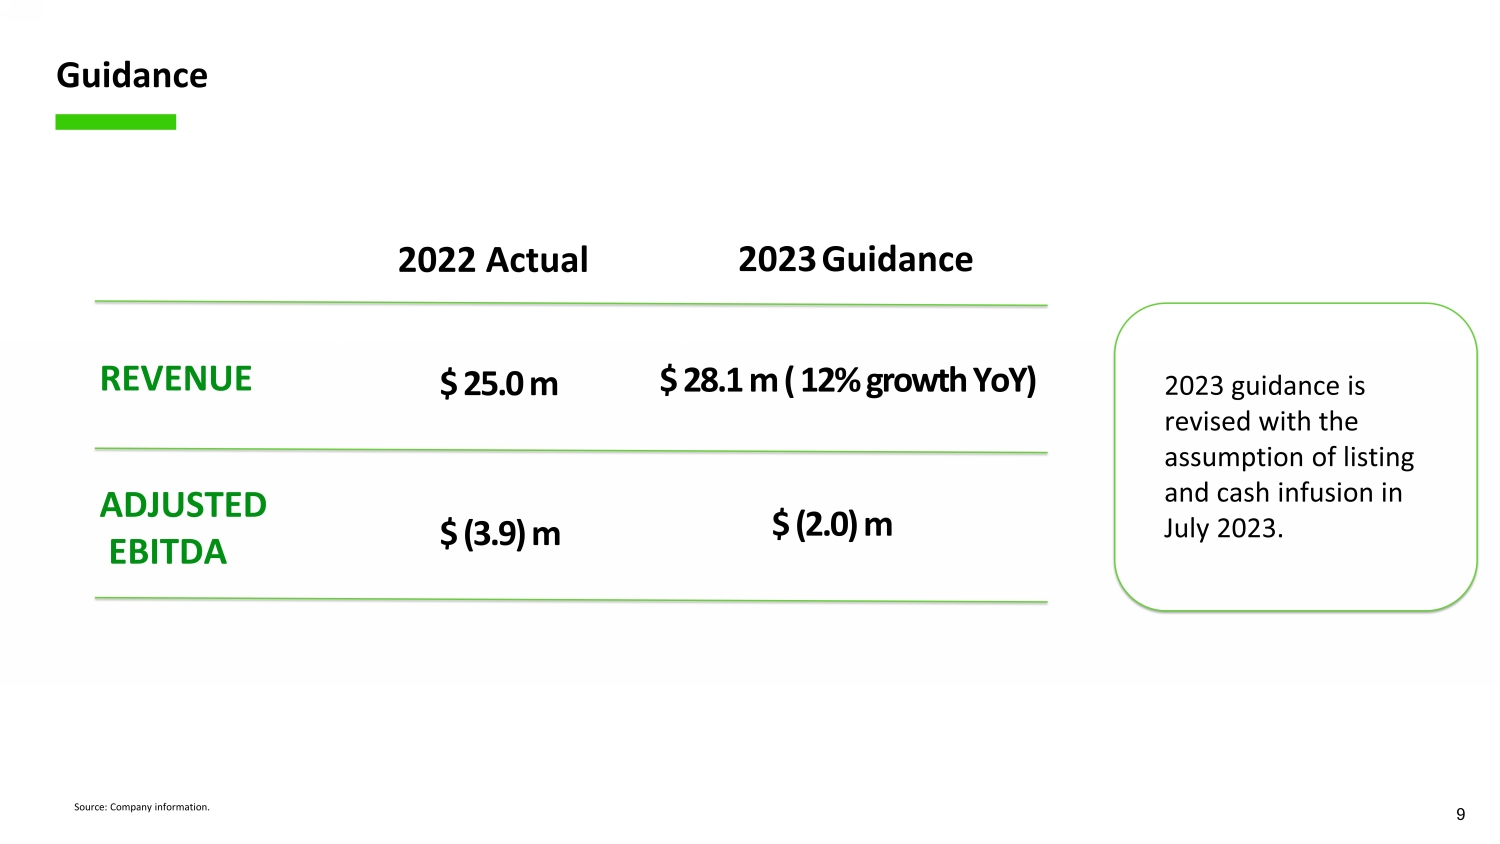
9 Guidance 2022 Actual 2023 Guidance REVENUE ADJUSTED EBITDA $ 25 . 0 m $ 28 . 1 m ( 12 % growth YoY ) $ ( 3 . 9 ) m $ ( 2 . 0 ) m Source: Company information . 2023 guidance is revised with the assumption of listing and cash infusion in July 2023 .
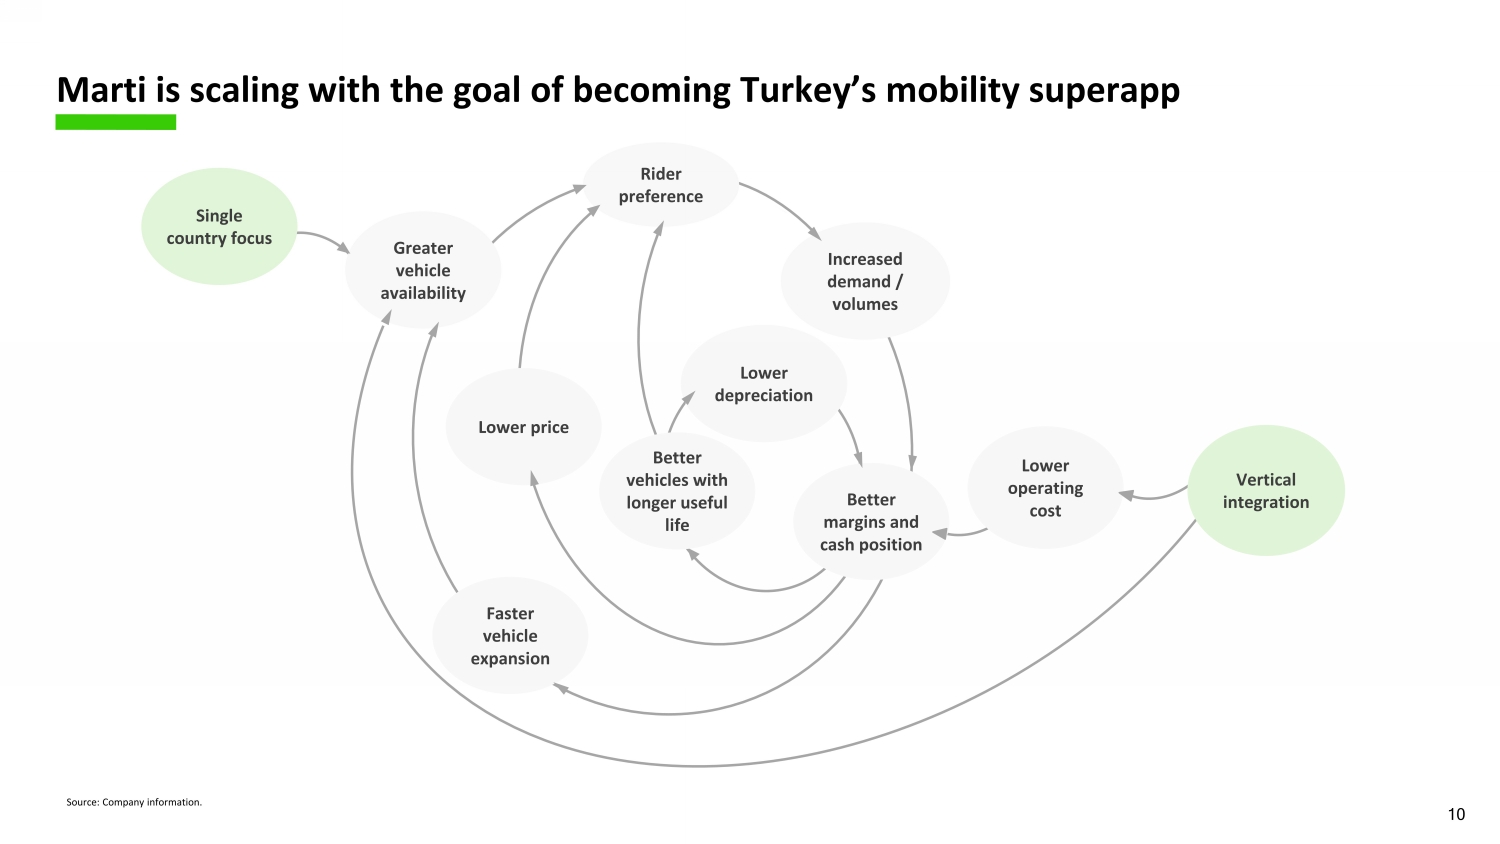
Lower depreciation Single country focus Greater vehicle availability Lower operating cost Rider preference Increased demand / volumes Lower price Better margins and cash position Faster vehicle expansion Better vehicles with longer useful life Vertical integration 10 Marti is scaling with the goal of becoming Turkey’s mobility superapp Source: Company information.
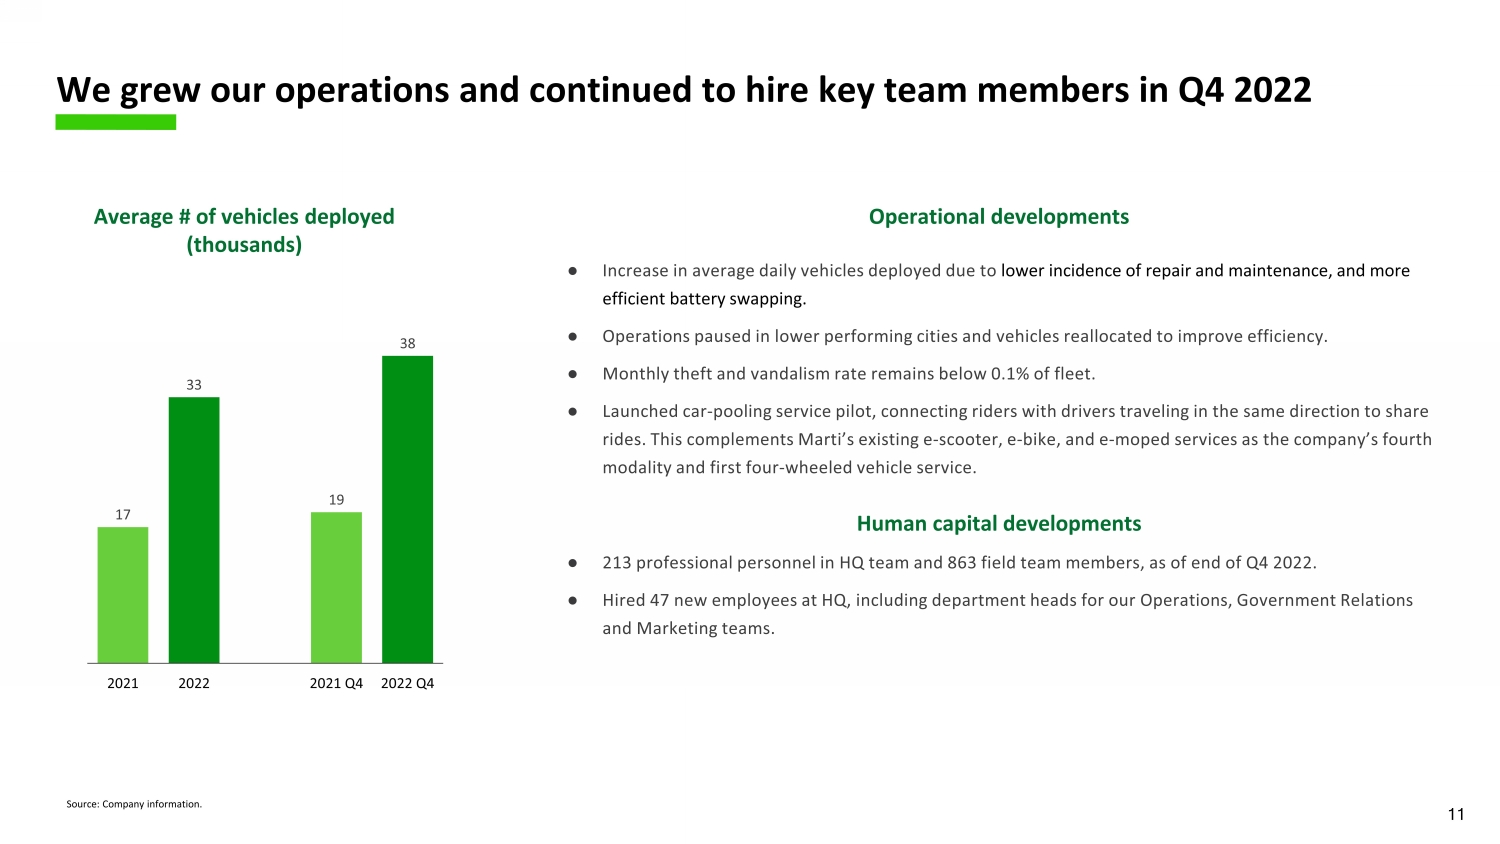
11 We grew our operations and continued to hire key team members in Q 4 2022 ● Increase in average daily vehicles deployed due to lower incidence of repair and maintenance , and more efficient battery swapping . ● Operations paused in lower performing cities and vehicles reallocated to improve efficiency . ● M onthly theft and vandalism rate remains below 0.1% of fleet . ● Launched car - pooling service pilot, connecting riders with drivers traveling in the same direction to share rides . This complements Marti’s existing e - scooter, e - bike , and e - moped services as the company’s fourth modality and first four - wheeled vehicle service. ● 213 professional personnel in HQ team and 863 field team members, as of end of Q 4 2022. ● Hired 47 new employees at HQ , including department heads for our Operations, Government Relations and Marketing teams . Human capital developments Operational developments Average # of vehicles deployed ( thousands ) Source: Company information . 17 33 19 38 2021 2022 2021 Q4 2022 Q4
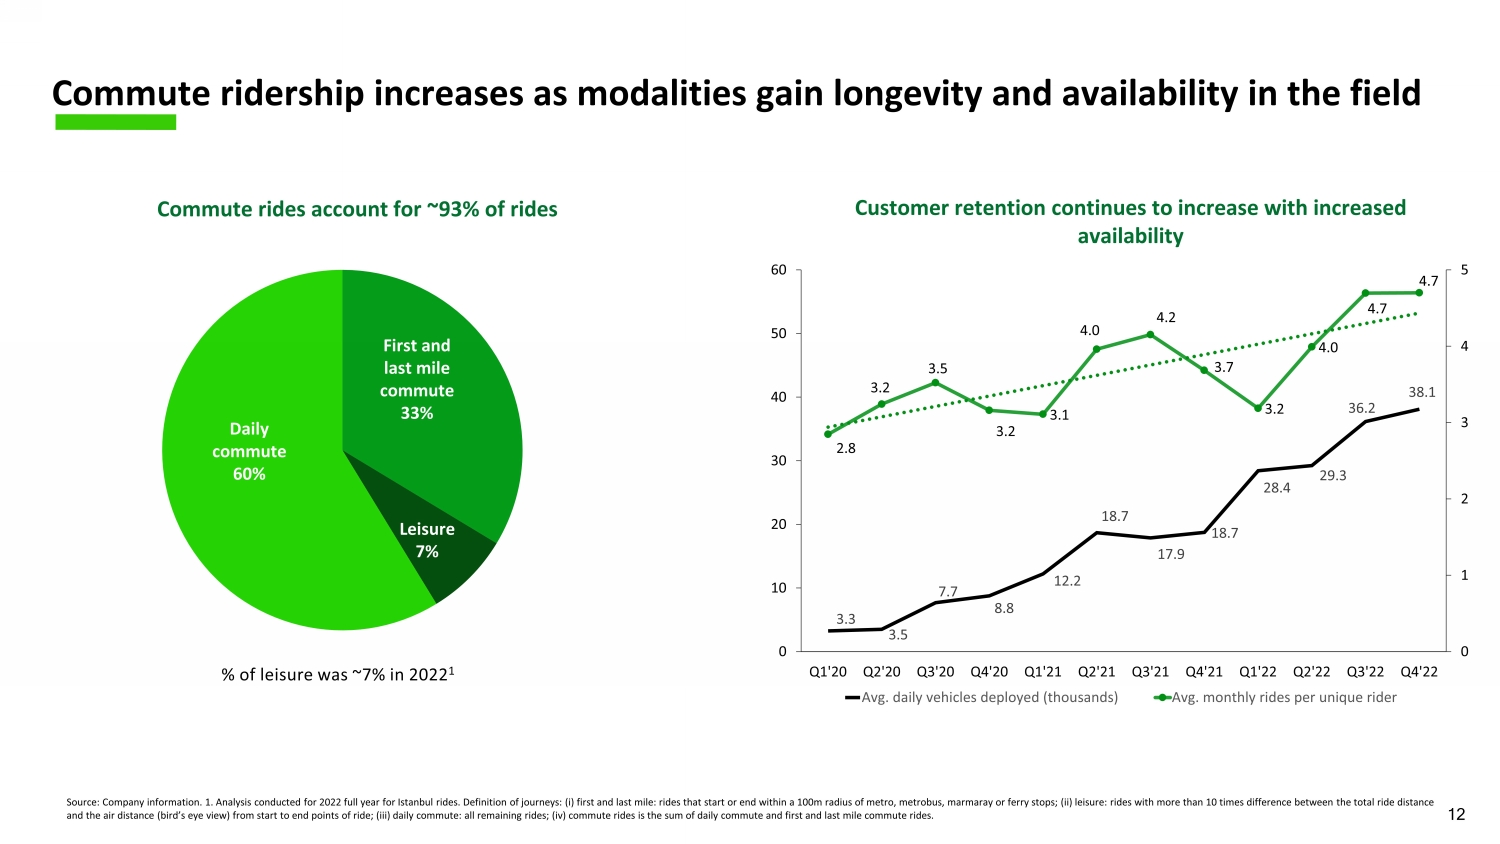
Customer retention continues to increase with increased availability Commute rides account for ~9 3 % of rides % of leisure was ~ 7 % in 2022 1 Commute ridership increases as modalities gain longevity and availability in the field 12 Daily commute 60 % First and last mile commute 3 3 % Leisure 7 % Source: Company information. 1. Analysis conducted for 2022 full year for Istanbul rides. Definition of journeys : (i) first and last mile: rides that start or end with in a 100m radius of metro, metrobus, m armara y or ferry stops; (ii) leisure: r ides with more than 10 times difference between the total ride distance and the air distance (bird’s eye view) from start to end points of rid e; (iii) daily c ommute : all remaining rides ; (iv) commute rides is the sum of daily commute and first and last mile commute rides . 3.3 3.5 7.7 8.8 12.2 18.7 17.9 18.7 28.4 29.3 36.2 38.1 2.8 3.2 3.5 3.2 3.1 4.0 4.2 3.7 3.2 4.0 4.7 4.7 0 1 2 3 4 5 0 10 20 30 40 50 60 Q1'20 Q2'20 Q3'20 Q4'20 Q1'21 Q2'21 Q3'21 Q4'21 Q1'22 Q2'22 Q3'22 Q4'22 Avg. daily vehicles deployed (thousands) Avg. monthly rides per unique rider
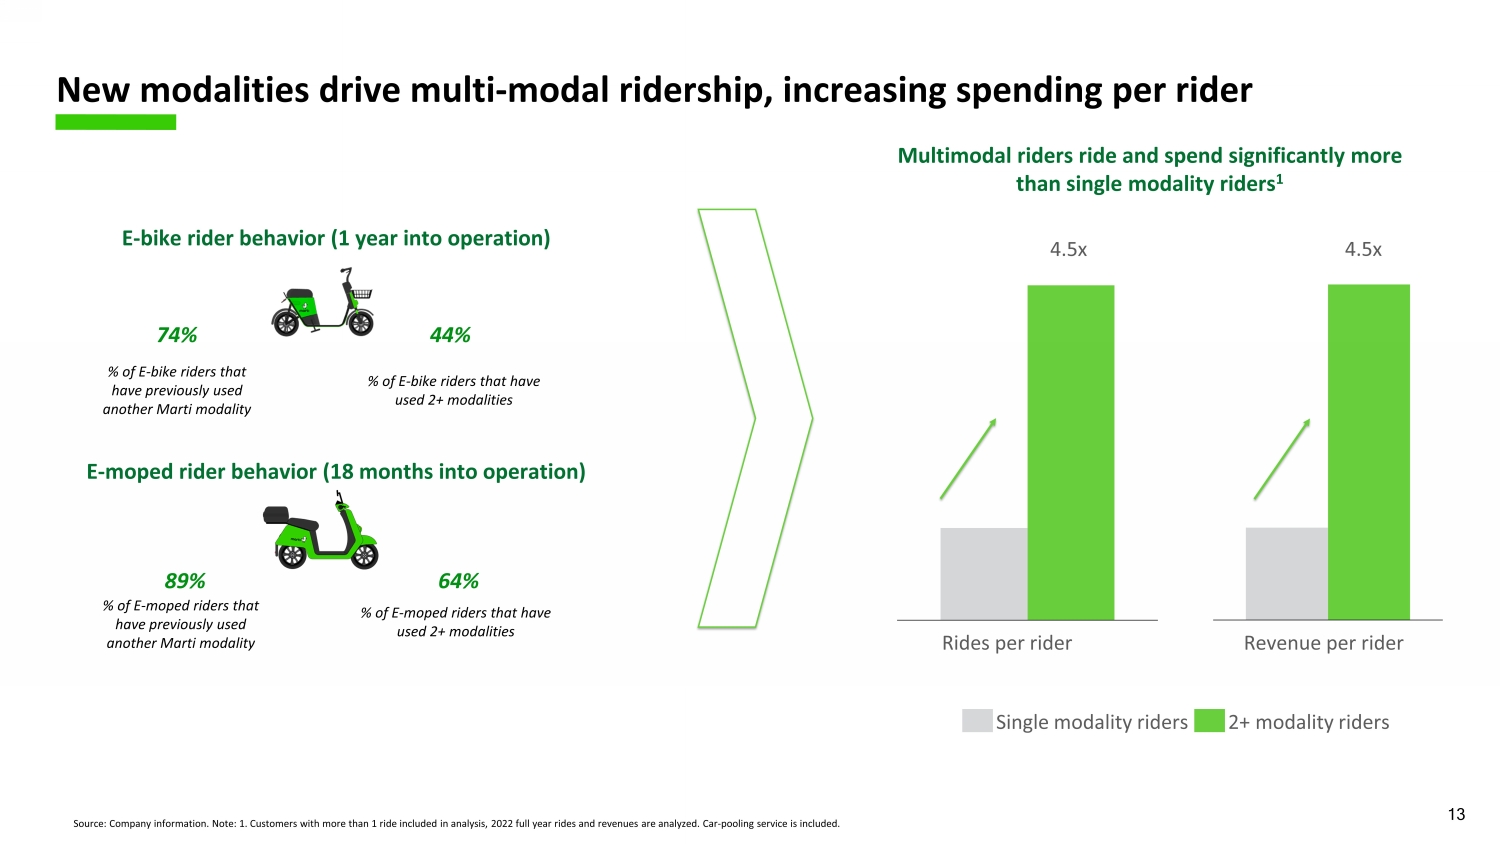
13 E - bike rider behavior (1 year into operation ) % of E - bike riders that have used 2+ modalities % of E - bike riders that have previously used another Marti modality 44 % 74 % E - moped rider behavior (18 months into operation ) % of E - moped riders that have previously used another Marti modality 64 % 89 % % of E - moped riders that have used 2+ modalities Multimodal riders ride and spend significantly more than single modality riders 1 Revenue per rider 4.5 x Rides per rider 4.5x Single modality riders 2+ modality riders New modalities drive multi - modal ridership, increasing spending per rider Source: Company information . Note: 1 . Customers with more than 1 ride included in analysis , 2022 full year rides and revenues are analyzed. Car - pooling service is included .
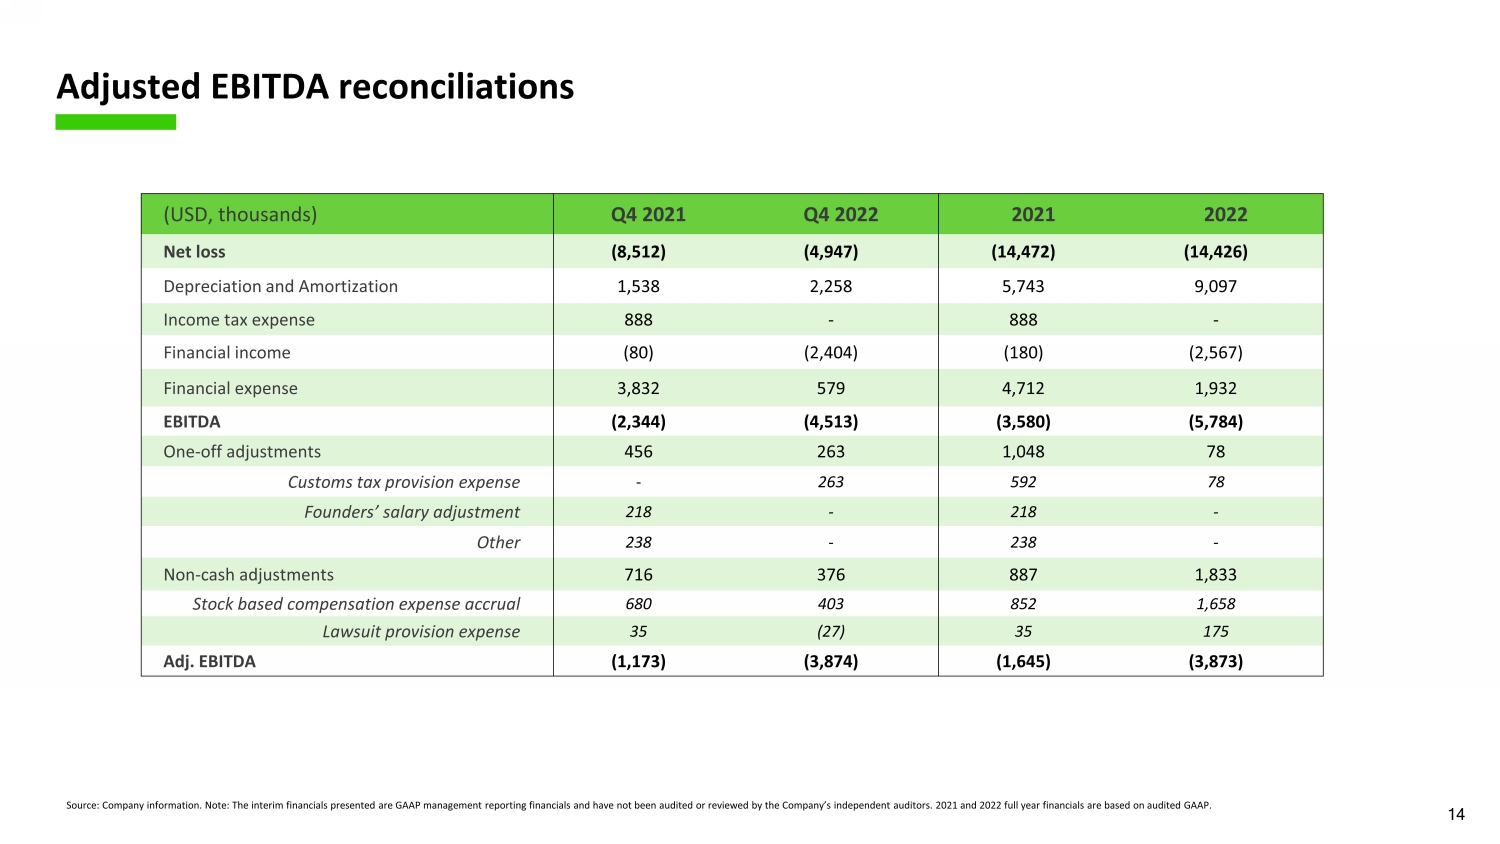
14 Adjusted EBITDA reconciliations Source: Company information. Note : The interim financials presented are GAAP management reporting financials and have not been audited or reviewed by the Company’s independent auditors . 2021 and 2022 full year financials are b ased on audited GAAP . ( USD, thousands ) Q4 2021 Q4 2022 2021 2022 Net loss (8,512) (4,947) (14,472) (14,426) Depreciation and Amortization 1,538 2,258 5,743 9,097 Income tax expense 888 - 888 - Financial income (80) (2,404) (180) (2,567) Financial expense 3,832 579 4,712 1,932 EBITDA (2,344) (4,513) (3,580) (5,784) One - off adjustments 456 263 1,048 78 Customs tax provision expense - 263 592 78 Founders ’ salary adjustment 218 - 218 - Other 238 - 238 - Non - cash adjustments 716 376 887 1,833 Stock based compensation expense accrual 680 403 852 1,658 Lawsuit provision expense 35 (27) 35 175 Adj . EBITDA (1,173) (3,874) (1,645) (3,873)

15 MARTI INVESTOR RELATIONS investor.relations@marti.tech