Filed by Galata Acquisition Corp.
Pursuant to Rule 425 under the Securities Act of 1933
and deemed filed pursuant to Rule 14a-12
under the Securities Exchange Act of 1934
Subject Company: Galata Acquisition Corp.
Commission File No.: 001-40588
Date: January 5, 2023
TURKEY’S LEADING MOBILITY APP 01.05.2023 01.04.2023
About this Presentation This confidential presentation (this “Presentation”) is for informational purposes only to assist interested parties in making their own evaluation with respect to an investment in connection with a possible transaction (the “Business Combination”) involving Marti Technologies Inc . (“Marti” or the “Company”) and Galata Acquisition Corp . (“Galata” or “SPAC”), and for no other purpose . The information contained herein does not purport to be all - inclusive and none of Galata, the Company or their respective representatives or affiliates makes any representation or warranty, express or implied, as to the accuracy, completeness or reliability of the information contained in this Presentation . This Presentation and any oral statements made in connection with this Presentation do not constitute (i) a solicitation of a proxy, consent or authorization with respect to any securities or in respect of the proposed Business Combination or (ii) an offer to sell, a solicitation of an offer to buy or a recommendation to purchase any securities . No such offering of securities shall be made except by means of a prospectus meeting the requirements of section 10 of the Securities Act of 1933 , as amended (the “Securities Act”), or an exemption therefrom . You should not construe the contents of this Presentation as legal, tax, accounting, investment or other advice or a recommendation . You should consult your own counsel and tax and financial advisors as to legal and related matters concerning the matters described herein, and, by accepting this Presentation, you confirm that you are not relying upon the information contained herein to make any decision . The distribution of this Presentation may also be restricted by law and persons into whose possession this Presentation comes should inform themselves about, and observe, any such restrictions . The recipient acknowledges that it is (a) aware that the United States securities laws prohibit any person who has material, non - public information concerning a company from purchasing or selling securities of such company or from communicating such information to any other person under circumstances in which it is reasonably foreseeable that such person is likely to purchase or sell such securities, and (b) familiar with the Securities Exchange Act of 1934 , as amended, and the rules and regulations promulgated thereunder (collectively, the "Exchange Act"), and that the recipient will neither use, nor cause any third party to use, this Presentation or any information contained herein in contravention of the Exchange Act, including, without limitation, Rule 10 b - 5 thereunder . This Presentation and information contained herein constitutes confidential information and is provided to you on the condition that you agree that you will hold it in strict confidence and not reproduce, disclose, forward or distribute it in whole or in part without the prior written consent of SPAC and the Company and is intended for the recipient hereof only . By accepting this Presentation, the recipient agrees (a) to maintain the confidentiality of all information that is contained in this Presentation and not already in the public domain and (b) to return or destroy all copies of this Presentation or portions thereof in its possession upon request . This Presentation is being distributed to selected recipients only and is not intended for distribution to, or use by, any person or entity in any jurisdiction or country where such distribution or use would be contrary to local law or regulation . Neither this Presentation nor any part of it may be taken or transmitted into the United States or published, released, disclosed or distributed, directly or indirectly, in the United States, as that term is defined in the Securities Act, except to a limited number of qualified institutional buyers, as defined in Rule 144 A under the Securities Act, or institutional “accredited investors” within the meaning of Regulation D under the Securities Act . Forward Looking Statements Certain statements in this Presentation may be considered forward - looking statements within the meaning of the U . S . federal securities laws with respect to the proposed Business Combination . Forward - looking statements generally relate to future events, such as the benefits of the Business Combination or the anticipated timing of the Business Combination , or SPAC or the Company’s future financial or operating performance . For example, statements regarding anticipated growth in the industry in which the Company operates and anticipated growth in demand for the Company’s products, projections of the Company’s future financial results, possible growth opportunities for the Company and other metrics are forward - looking statements . In some cases, you can identify forward - looking statements by terminology such as “pro forma,” “may,” “should,” “could,” “might,” “plan,” “possible,” “project,” “strive,” “budget,” “forecast,” “expect,” “intend,” “will,” “estimate,” “anticipate,” “believe,” “predict,” “potential” and “continue” or the negatives of these terms or variations of them or similar terminology . Such forward - looking statements are subject to risks, uncertainties and other factors which could cause actual results to differ materially from those expressed or implied by such forward - looking statements . These forward - looking statements are based upon estimates and assumptions that, while considered reasonable by SPAC, the Company and their respective management, as the case may be, are inherently uncertain . Factors that may cause actual results to differ materially from current expectations include, but are not limited to : competition ; the ability of the company to grow and manage growth, maintain relationships with consumers, suppliers and strategic partners and retain its management and key employees ; costs related to the Business Combination ; changes in applicable laws or regulations ; the possibility that the Company may be adversely affected by other economic, business or competitive factors ; the Company’s estimates of expenses and profitability ; the evolution of the markets in which the Company competes ; the ability of the Company to implement its strategic initiatives and continue to innovate its existing products ; the ability of the Company to defend its intellectual property ; and the impact of the COVID - 19 pandemic on the Company’s business . Nothing in this Presentation should be regarded as a representation by any person that the forward - looking statements set forth herein will be achieved or that any of the contemplated results of such forward - looking statements will be achieved . You should not place undue reliance on forward - looking statements, which speak only as of the date they are made . Neither SPAC nor the Company undertakes any duty to update or revise these forward - looking statements . You should consult the risk factors included in this Presentation and SPAC’s public filings with the SEC, including the “Risk Factors” section in the registration statement on Form F - 4 and the proxy statement included therein (the “Registration Statement”) that SPAC filed relating to the proposed Business Combination and the “Risk Factors” section of other documents that SPAC files with the SEC from time to time, for additional information regarding risks and uncertainties related to the potential Business Combination and which could cause actual future events to differ materially from the forward - looking statements in this Presentation . Forward - looking statements speak only as of the date they are made . Readers are cautioned not to put undue reliance on forward - looking statements, and SPAC and Marti assume no obligation and do not intend to update or revise these forward - looking statements, whether as a result of new information, future events or otherwise . Disclaimers 2
Use of Projections This Presentation contains financial forecasts for the Company with respect to certain financial results for the Company’s fiscal years 2022 through 2023 . The Company’s independent auditors have not audited, studied, reviewed, compiled or performed any procedures with respect to the projections for the purpose of their inclusion in this Presentation, and accordingly, they did not express an opinion or provide any other form of assurance with respect thereto for the purpose of this Presentation . These projections are forward - looking statements and should not be relied upon as being necessarily indicative of future results . In this Presentation, certain of the above - mentioned projected information has been provided for purposes of providing comparisons with historical data . The assumptions and estimates underlying the prospective financial information are inherently uncertain and are subject to a wide variety of significant business, economic, competitive and other risks and uncertainties that could cause actual results to differ materially from those contained in the prospective financial information . Accordingly, there can be no assurance that the prospective results are indicative of the future performance of the Company or that actual results will not differ materially from those presented in the prospective financial information . Inclusion of the prospective financial information in this Presentation should not be regarded as a representation by any person that the results contained in the prospective financial information will be achieved . The performance projections and estimates are subject to the ongoing COVID - 19 pandemic, and have the potential to be revised to take into account further adverse effects of the COVID - 19 pandemic on the future performance of SPAC and Marti . Projected financial results and estimates are based on an assumption that public health, economic, market and other conditions will improve ; however, there can be no assurance that such conditions will improve within the time period or to the extent estimated by SPAC or Marti . The full impact of the COVID - 19 pandemic on future performance is particularly uncertain and difficult to predict ; therefore actual results may vary materially and adversely from the projections included herein . Financial Information ; Non - GAAP Measures The financial information for the nine months ended September 30 , 2021 and 2022 and data contained in this Presentation is unaudited and does not conform to Regulation S - X promulgated under the Securities Act . Such information and data may not be included in, may be adjusted in or may be presented differently in, the registration statement on Form F - 4 filed by Galata relating to the Business Combination and the proxy statement/prospectus contained therein . This Presentation also includes certain financial measures not presented in accordance with generally accepted accounting principles of the United States (“GAAP”) including, but not limited to, Adjusted EBITDA and certain ratios and other metrics derived therefrom . The Company defines Adjusted EBITDA as net income (loss) plus non - operating income (loss), depreciation and amortization, net interest expense, income taxes, stock - based compensation and transaction costs . These non - GAAP financial measures are not measures of financial performance in accordance with GAAP and may exclude items that are significant in understanding and assessing the Company’s financial results . Therefore, these measures should not be considered in isolation or as an alternative to net income, cash flows from operations or other measures of profitability, liquidity or performance under GAAP . You should be aware that the Company’s presentation of these measures may not be comparable to similarly - titled measures used by other companies . The Company believes these non - GAAP measures of financial results provide useful information for management and investors regarding certain financial and business trends relating to the Company’s financial condition and results of operations . The Company believes the use of these non - GAAP financial measures provides an additional tool for investors to use in evaluating ongoing operating results and trends and in comparing the Company’s financial measures with other similar companies, many of which present similar non - GAAP financial measures to investors . These non - GAAP financial measures are subject to inherent limitations as they reflect the exercise of judgments by management about which expense and income are excluded or included in determining these non - GAAP financial measures . This Presentation also includes certain projections of non - GAAP financial measures . Due to the high variability and difficulty in making accurate forecasts and projections of some of the information excluded from these projected measures, together with some of the excluded information not being ascertainable or accessible, the Company is unable to quantify certain amounts that would be required to be included in the most directly comparable GAAP financial measures without unreasonable effort . Consequently, no disclosure of estimated comparable GAAP measures is included and no reconciliation of the forward - looking non - GAAP financial measures is included . Industry and Market Data In this Presentation, SPAC and the Company rely on and refer to certain information and statistics obtained from third - party sources which SPAC and the Company believe to be reliable . While SPAC and the Company believe such third - party information is reliable, there can be no assurance as to the accuracy or completeness of the indicated information, and the Company has not independently verified the accuracy or completeness of any such information . Trademarks This Presentation contains trademarks, service marks, trade names and copyrights of other companies, which are the property of their respective owners . The Company’s use thereof does not imply an affiliation with, or endorsement by, the owners of such trademarks, service marks, trade names and copyrights . Solely for convenience, some of the trademarks, service marks, trade names and copyrights referred to in this Presentation may be listed without the TM, SM © or ® symbols, but the Company will assert, to the fullest extent under applicable law, the rights of the applicable owners to these trademarks, service marks, trade names and copyrights . There is no guarantee that either SPAC or the Company will work, or continue to work, with any of the firms or businesses whose logos are included herein in the future . Disclaimers (cont’d) 3
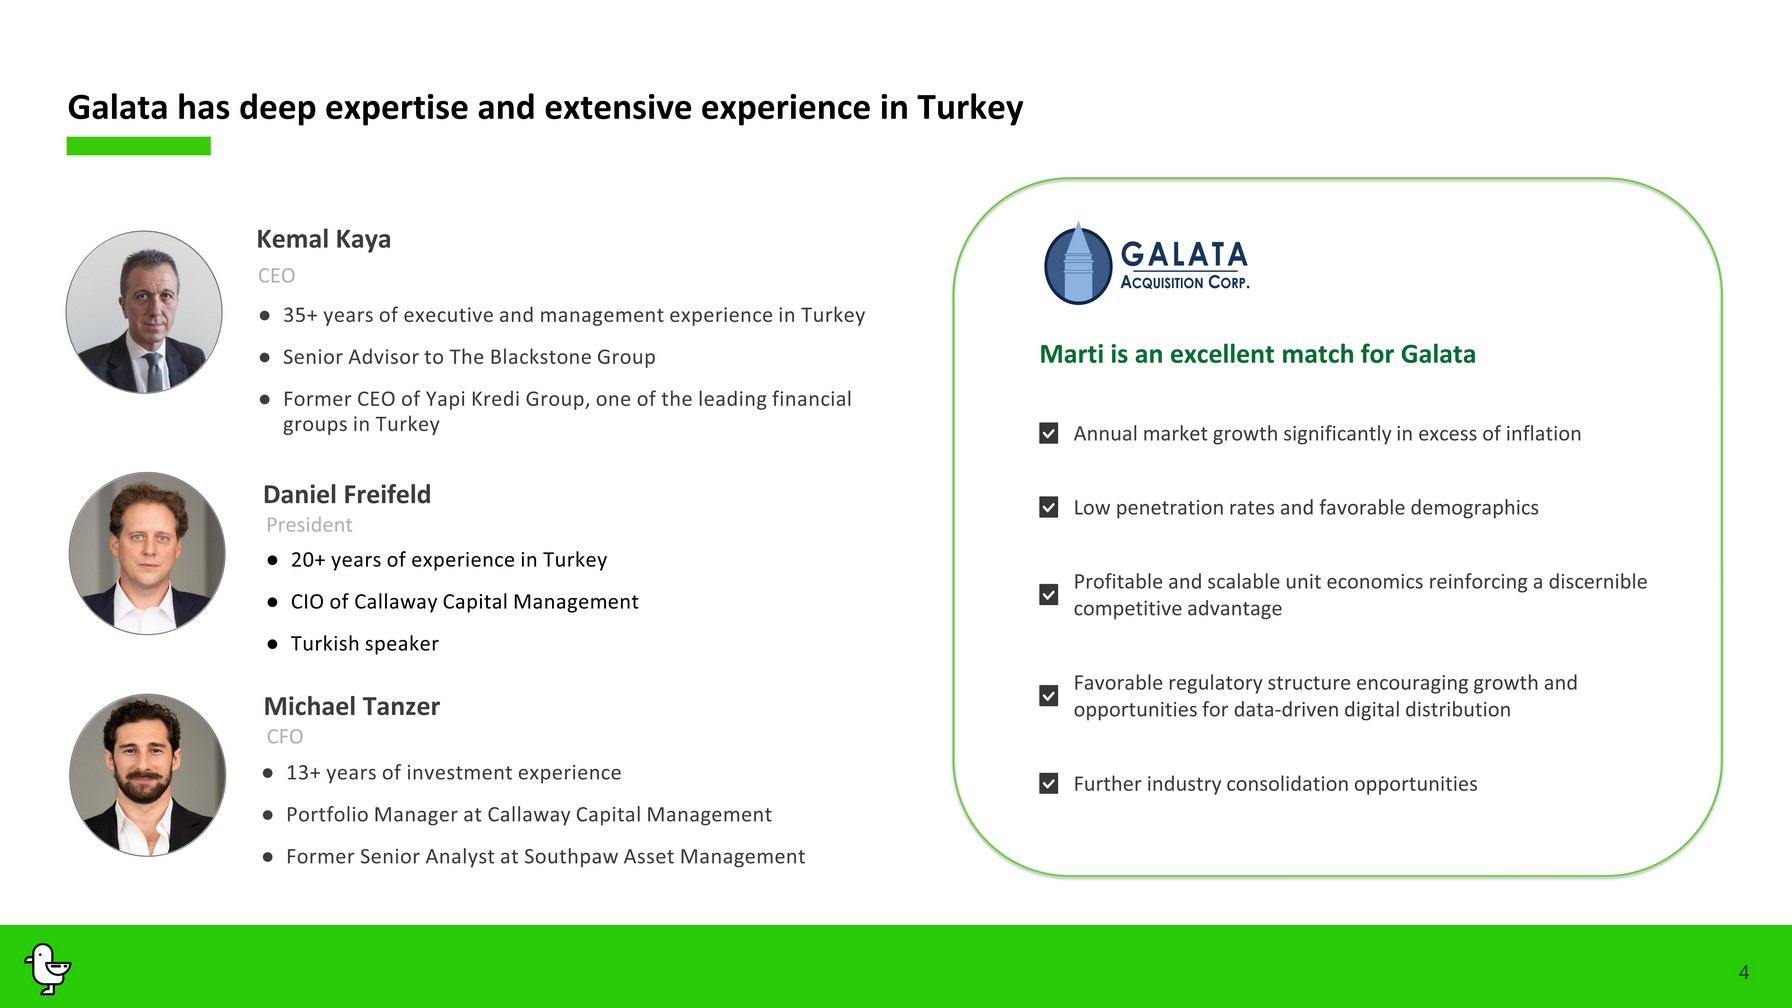
Marti is an excellent match for Galata Profitable and scalable unit economics reinforcing a discernible competitive advantage Favorable regulatory structure encouraging growth and opportunities for data - driven digital distribution Further industry consolidation opportunities Low penetration rates and favorable demographics Annual market growth significantly in excess of inflation 4 Galata has deep expertise and extensive experience in Turkey ● 35+ years of executive and management experience in Turkey ● Senior Advisor to The Blackstone Group ● Former CEO of Yapi Kredi Group, one of the leading financial groups in Turkey Kemal Kaya CEO ● 20+ years of experience in Turkey ● CIO of Callaway Capital Management ● Turkish speaker Daniel Freifeld President ● 13+ years of investment experience ● Portfolio Manager at Callaway Capital Management ● Former Senior Analyst at Southpaw Asset Management Michael Tanzer CFO
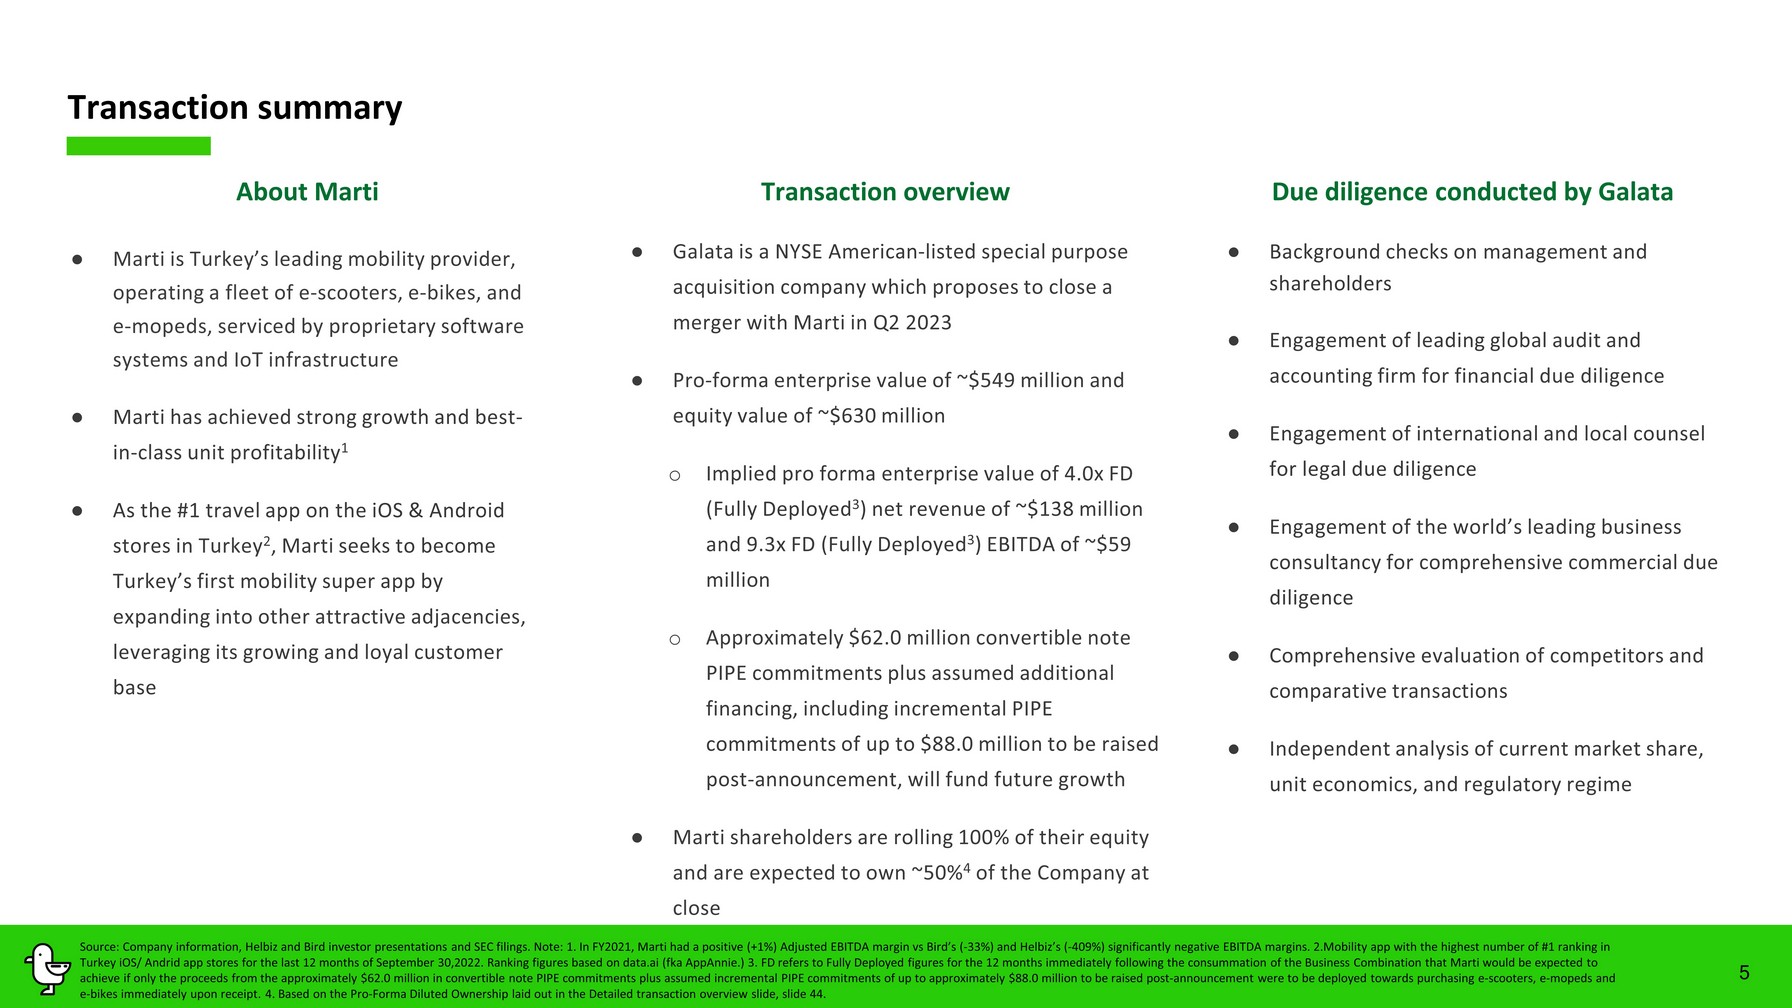
5 ● Marti is Turkey’s leading mobility provider, operating a fleet of e - scooters, e - bikes, and e - mopeds, serviced by proprietary software systems and IoT infrastructure ● Marti has achieved strong growth and best - in - class unit profitability 1 ● As the #1 travel app on the iOS & Android stores in Turkey 2 , Marti seeks to become Turkey’s first mobility super app by expanding into other attractive adjacencies, leveraging its growing and loyal customer base Transaction summary ● Galata is a NYSE American - listed special purpose acquisition company which proposes to close a merger with Marti in Q 2 202 3 ● Pro - forma enterprise value of ~ $5 49 million and equity value of ~ $630 million o Implied pro forma enterprise value of 4.0 x FD (Fully Deployed 3 ) net revenue of ~ $ 138 million and 9.3 x FD (Fully Deployed 3 ) EBITDA of ~ $ 59 million o Approximately $ 62.0 million convertible note PIPE commitments plus assumed additional financing , including incremental PIPE commitments of up to $ 88.0 million to be raised post - announcement , will fund future growth ● Marti shareholders are rolling 100% of their equity and are expected to own ~ 50% 4 of the Company at close About Marti Transaction overview ● Background checks on management and shareholders ● Engagement of leading global audit and accounting firm for financial due diligence ● Engagement of international and local counsel for legal due diligence ● Engagement of the world’s leading business consultancy for comprehensive commercial due diligence ● Comprehensive evaluation of competitors and comparative transactions ● Independent analysis of current market share, unit economics, and regulatory regime Due diligence conducted by Galata Source: Company information, Helbiz and Bird investor presentations and SEC filings. Note: 1. In FY2021, Marti had a positive (+1%) Adjusted EBITDA margin vs Bird’s ( - 33%) and Helbiz’s ( - 409%) significantly negative EBITDA margins . 2. Mobility app with the highest number of #1 ranking in Turkey iOS/ Andrid app store s for the last 12 months of September 30,2022. Ranking figures based on data.ai ( fka AppAnnie .) 3 . FD refers to Fully Deployed figures for the 12 months immediately following the consummation of the Business Combination that M arti would be expected to achieve if only the proceeds from the approximately $62.0 million in convertible note PIPE commitments plus assumed increment al PIPE commitments of up to approximately $88.0 million to be raised post - announcement were to be deployed towards purchasing e - sc ooters, e - mopeds and e - bikes immediately upon receipt . 4 . Based on the Pro - Forma Diluted Ownership laid out in the Detailed transaction overview slide , slide 44.

Marti Overview
We believe… 7 Transportation is the number one issue in emerging market megacities Everything on wheels will be electric… …and everything electric will be shareable Source: Company information.

Onur Boztaş Chief Vehicle Officer Leadership team… 8 Cankut Durgun Cofounder, President Sena Ö ktem Cofounder, Deputy CEO Alper Ö ktem Founder, CEO Eyal Enriquez C hief Strategy Officer Erdem Selim C hief Financial Officer Source: Company information.
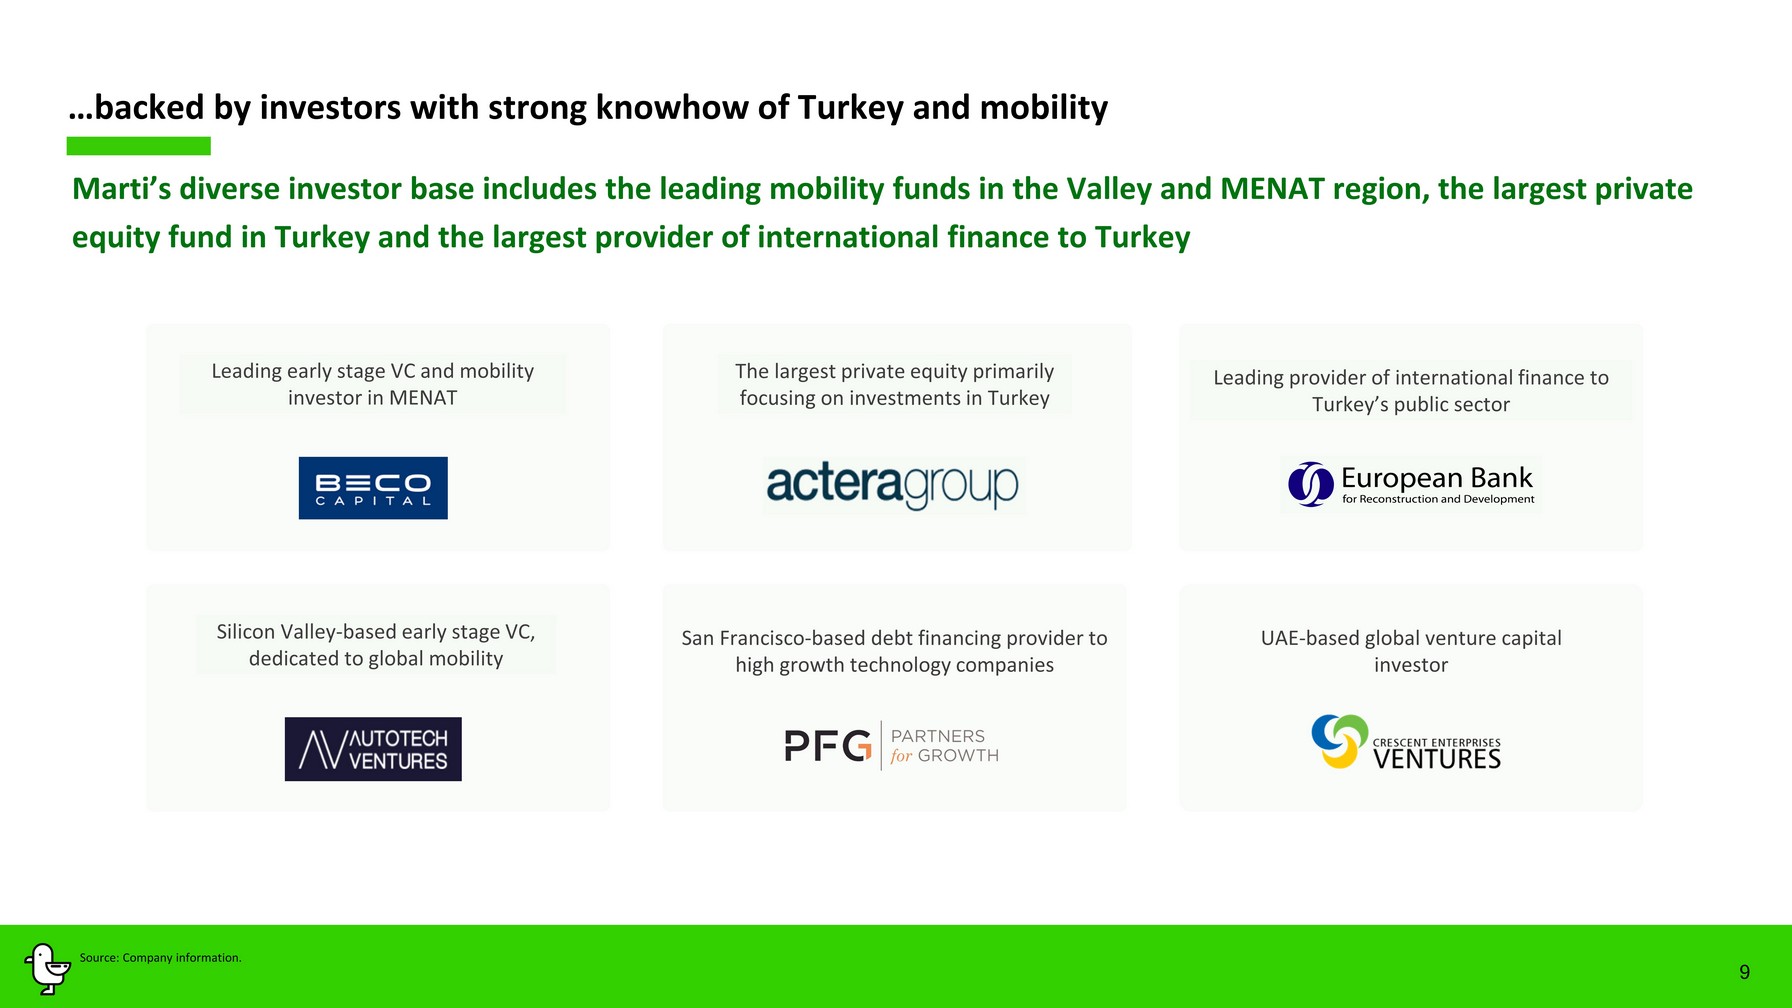
…b acked by investors with strong knowhow of Turkey and mobility Marti’s diverse investor base includes the leading mobility funds in the Valley and MENAT region, the largest private equity fund in Turkey and the largest provider of international finance to Turkey 9 Leading early stage VC and mobility i nvestor in MENAT Silicon Valley - based early stage VC, dedicated to global mobility The largest private equity primarily focusing on investments in Turkey S an F rancisco - based debt financing provider to high growth technology companies UAE - based global venture capital investor Leading provider of international finance to Turkey’s public sector Source: Company information.
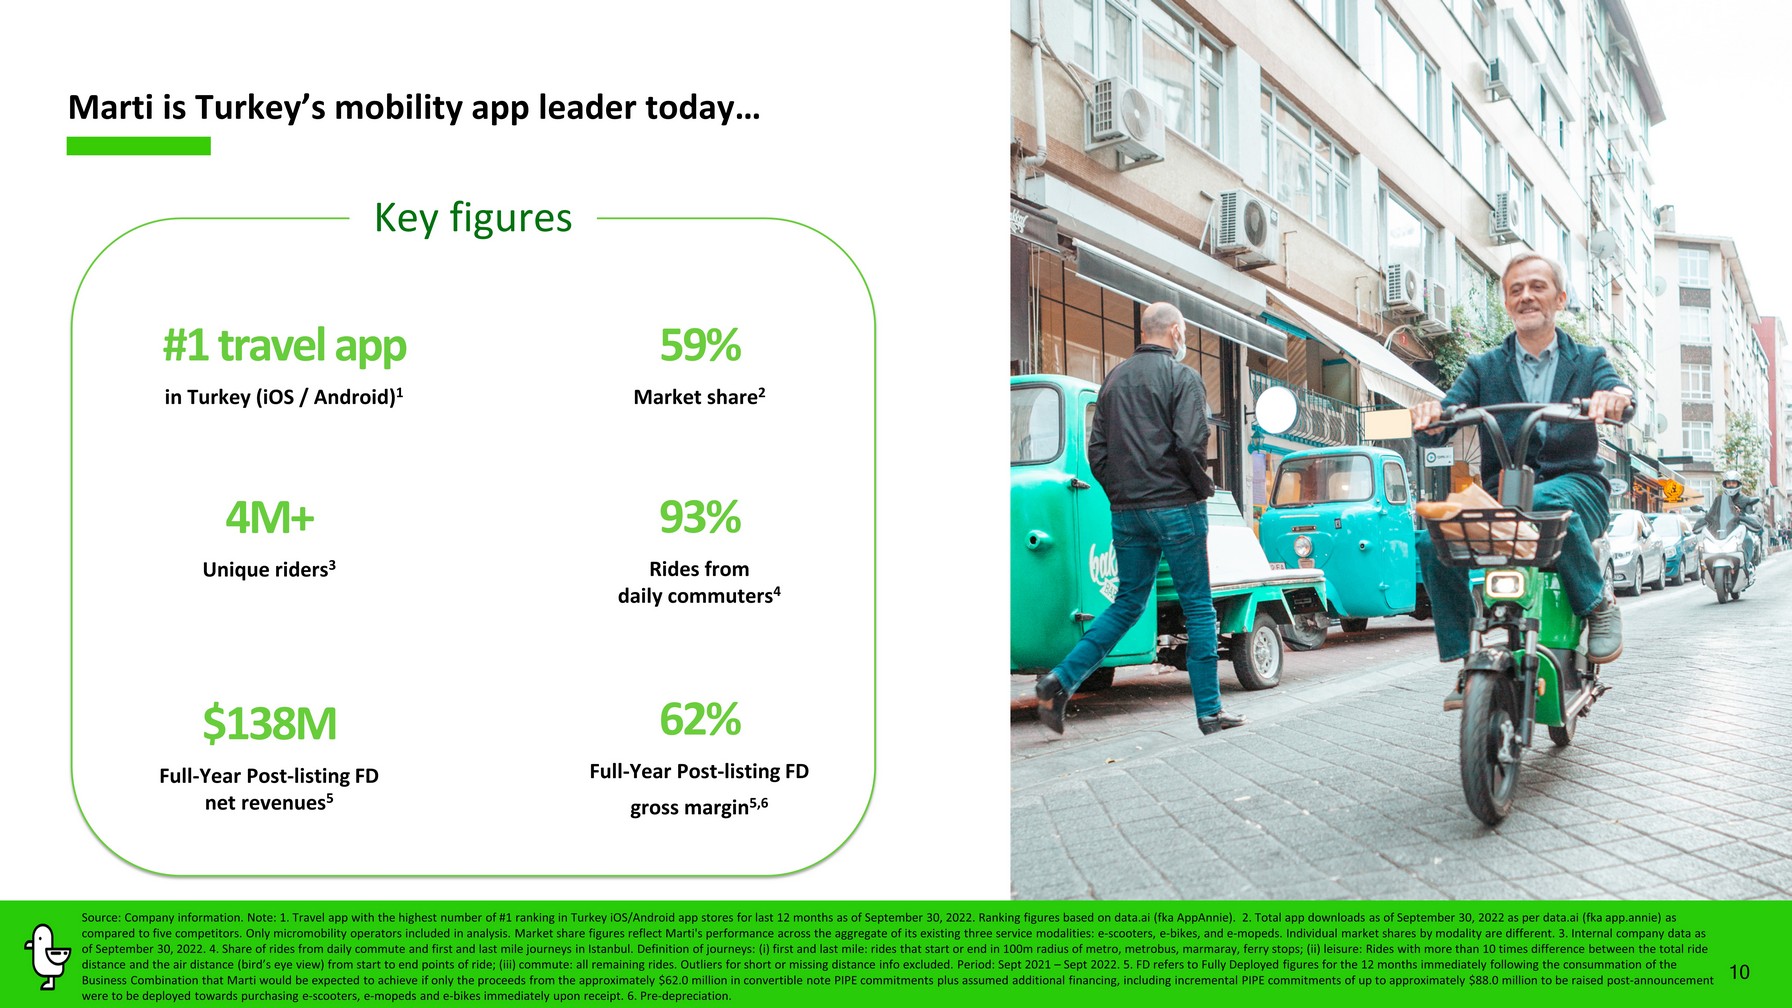
10 Marti is Turkey’s mobility app leader today… Key figures #1 travel app in Turkey (iOS / Android) 1 4 M + Unique riders 3 62 % Full - Year Post - listing FD gross m argin 5 ,6 9 3 % Rides from daily commute rs 4 $ 1 38 M Full - Year Post - listing FD net revenues 5 59 % Market share 2 Source: Company information. Note: 1. Travel app with the highest number of #1 ranking in Turkey iOS/Android app stores for l ast 12 months as of September 3 0 , 2022. Ranking figures based on data.ai ( fka AppAnnie ). 2. Total app downloads as of September 30 , 2022 as per data.ai ( fka app.annie ) as compared to five competitors. Only micromobility operators included in analysis. Market share figures reflect Marti's performance across the aggregate of its existing three s er vice modalities: e - scooters, e - bikes, and e - mopeds. Individual market shares by modality are different. 3. Internal company data as of September 30 , 2022. 4. Share of rides from daily commute and first and last mile journeys in Istanbul. Definition of journeys: ( i ) first and last mile: rides that start or end in 100m radius of metro, metrobus, marmaray , ferry stops; (ii) leisure: Rides with more than 10 times difference between the total ride distance and the air distance (bird’s eye view) from start to end points of ride ; (iii) commute: all remaining rides. Outliers for short or missing distance info excluded. Period: Sept 2021 – Sept 2022. 5. FD refers to Fully Deployed figures for the 12 months immediately following the consummation of the Business Combination that Marti would be expected to achieve if only the proceeds from the approximately $62.0 million in con ver tible note PIPE commitments plus assumed additional financing , including incremental PIPE commitments of up to approximately $88.0 million to be raised post - announcement were to be deployed towards purchasing e - scooters, e - mopeds and e - bikes immediately upon receipt . 6. Pre - depreciation.
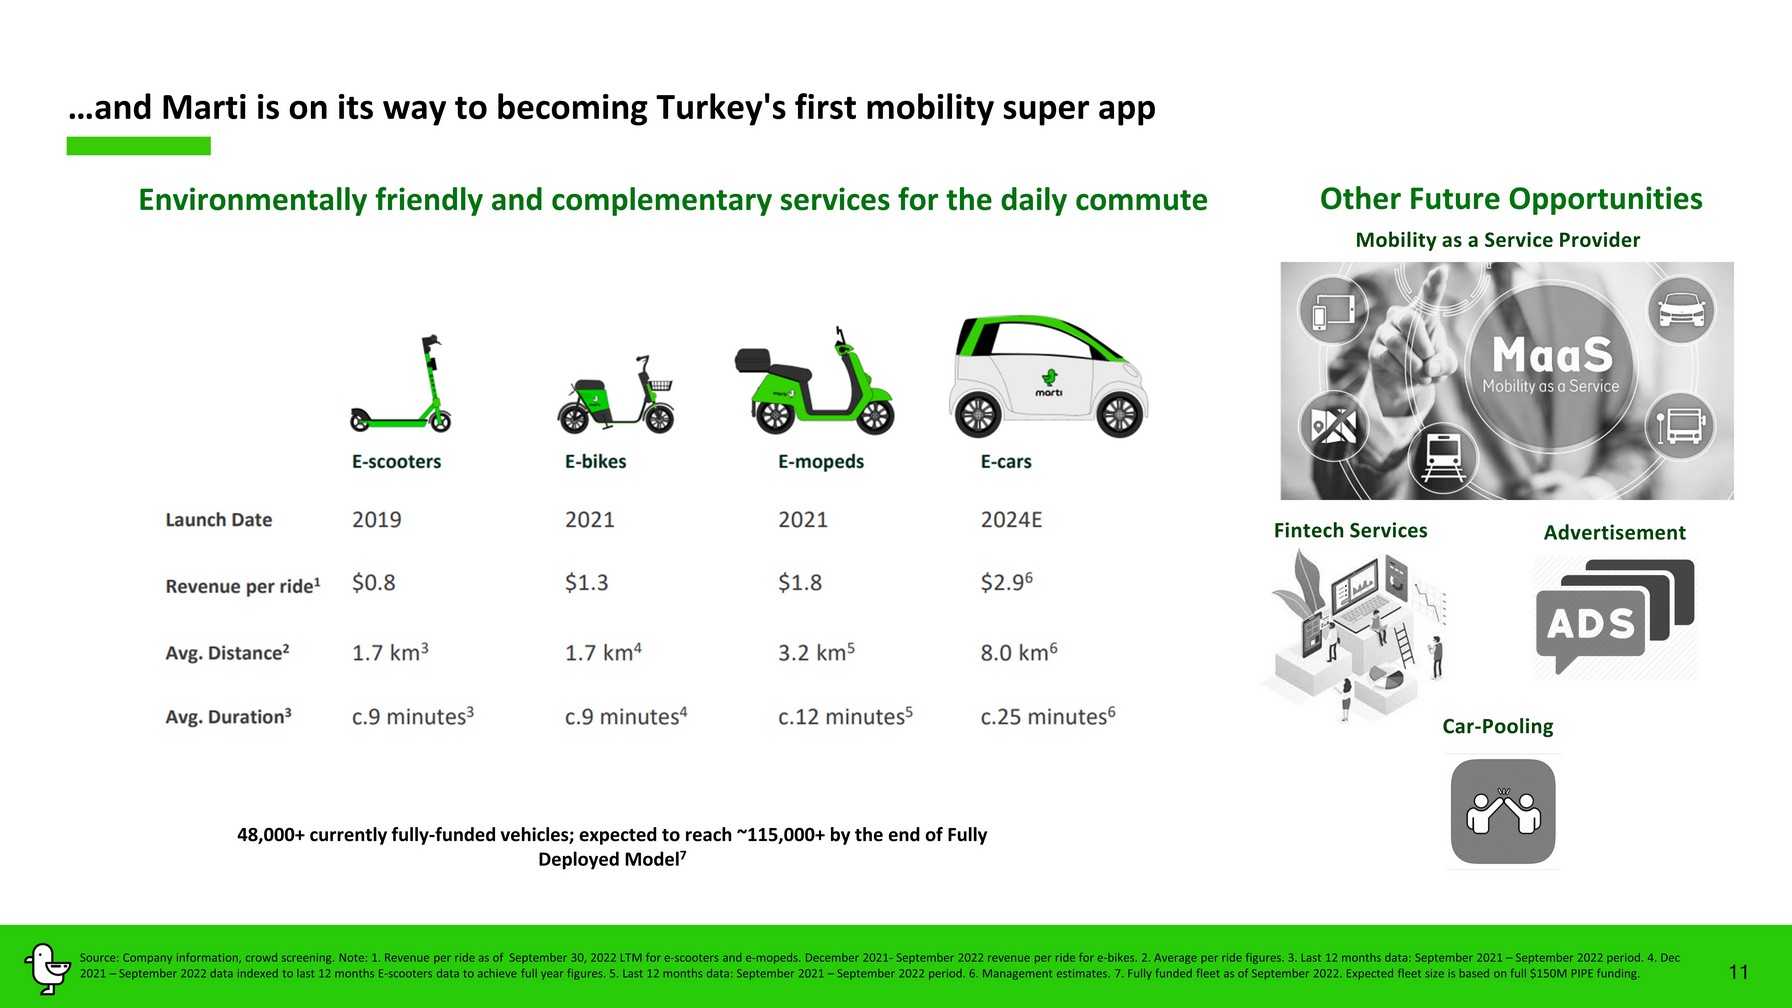
Environmentally friendly and complementary services for the daily commute …and Marti is on its way to becoming Turkey's first mobility super app 4 8 ,000+ currently full y - funded vehicles; expected to reach ~ 115 ,000+ by the end of Fully Deployed Model 7 Other Future Opportunities Advertisement Fintech Services Mobility as a Service Provider 11 Source: Company information, crowd screening. Note: 1 . Revenue per ride as of September 30, 2022 LTM for e - scooters and e - mopeds . December 2021 - September 2022 revenue per ride for e - bikes. 2. Average per ride figures. 3. Last 12 months data: September 2021 – September 2022 period. 4. Dec 2021 – September 2022 data indexed to last 12 months E - scooters data to achieve full year figures. 5. Last 1 2 months data: September 2021 – September 2022 period. 6. Management estimates. 7. Fully funded fleet as of September 2022. Expected fleet size is based on full $150M PIPE funding. Car - Pooling
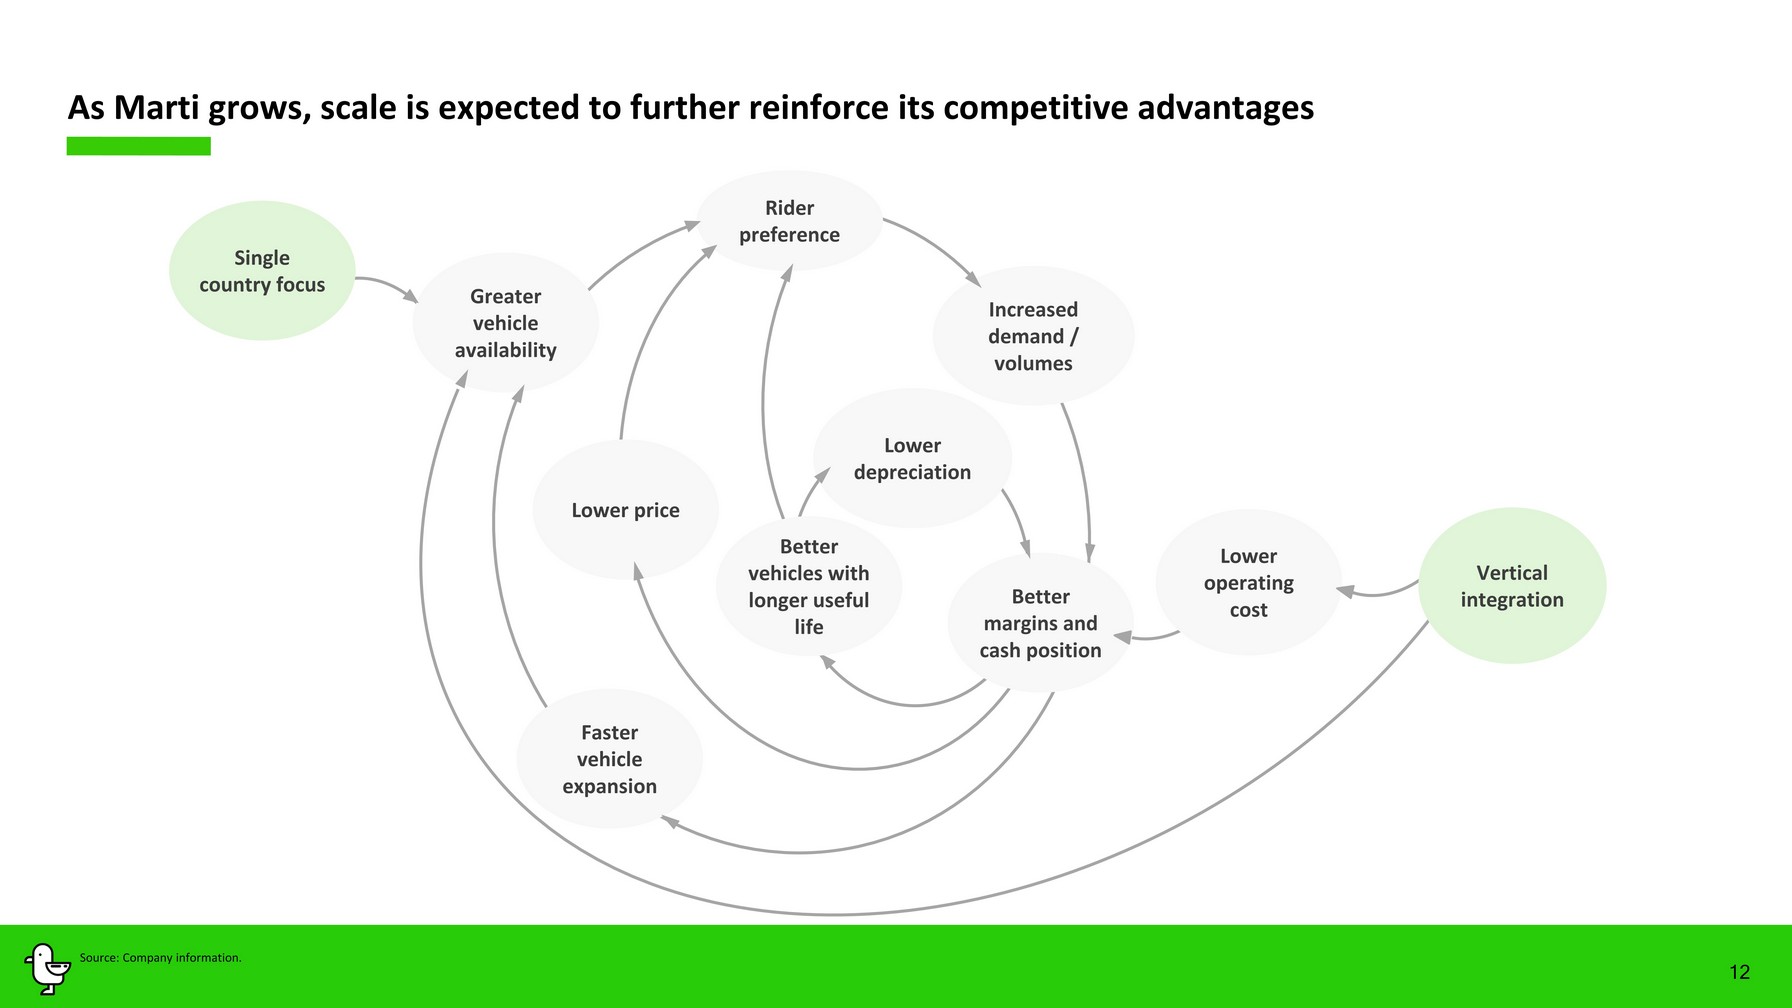
Lower depreciation Single country focus Greater vehicle availability Lower operating cost Rider preference Increased demand / volumes Lower price Better margins and cash position Faster vehicle expansion Better vehicles with longer useful life Vertical integration 12 As Marti grows, scale is expected to further reinforce its competitive advantages Source: Company information.
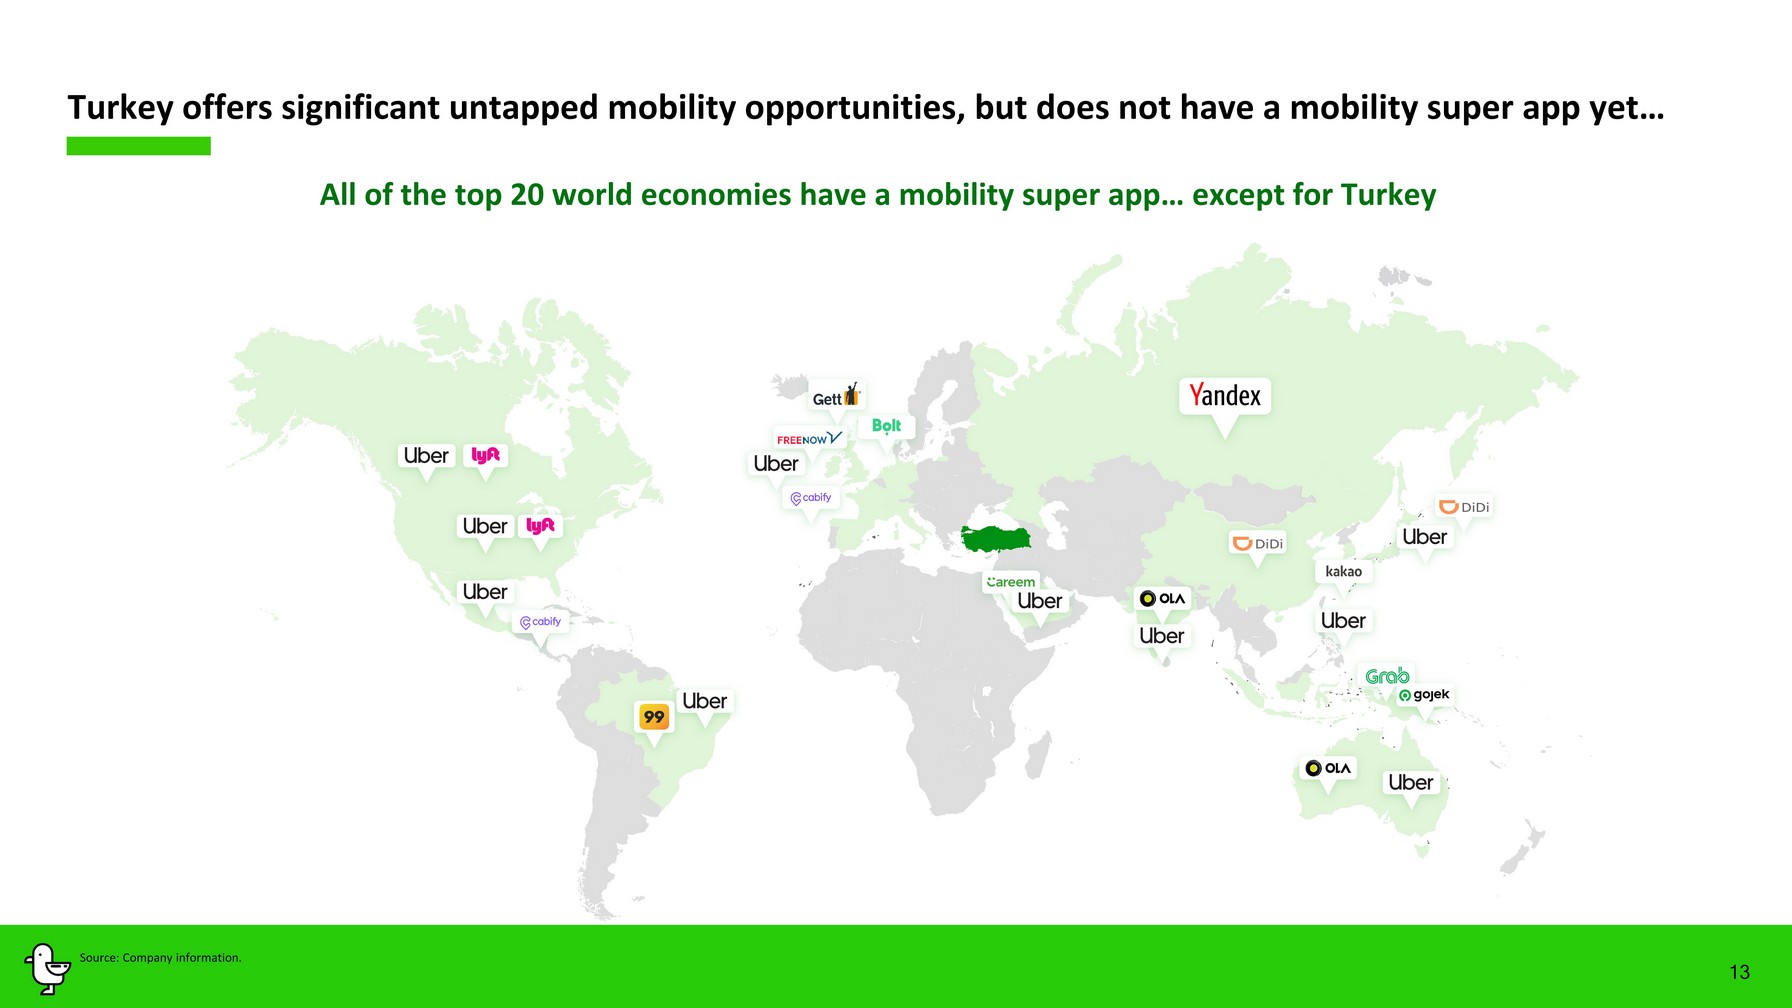
All of the top 20 world economies have a mobility super app … except for Turkey Turkey offers significant untapped mobility opportunities, but does not have a mobility super app yet… Source: Company information. 13
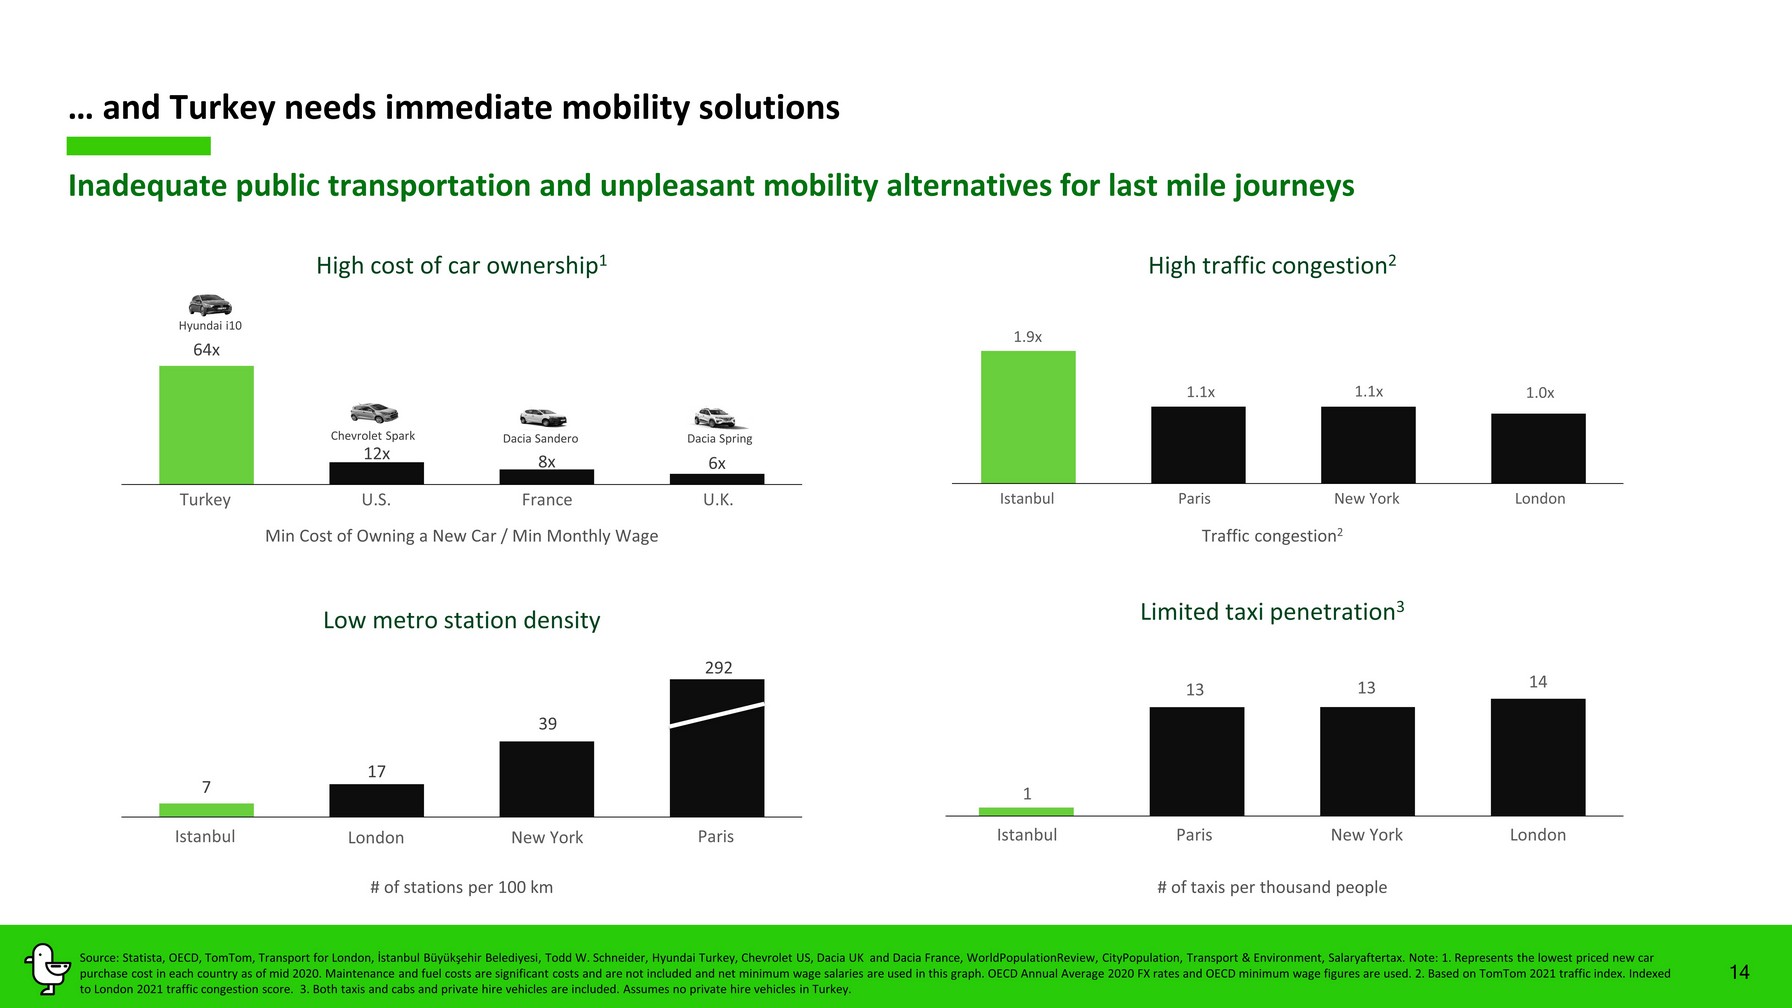
14 64x 12x 8x 6x Inadequate public transportation and unpleasant mobility alternatives for last mile journeys … and Turkey needs immediate mobility solutions High cost of car ownership 1 Dacia Sandero Dacia Spring Chevrolet Spark Hyundai i10 Min Cost of Owning a New Car / Min Monthly Wage Low metro station density Istanbul Paris London New York Turkey U.K. U.S. France 7 17 39 292 L imited taxi penetration 3 # of stations per 100 km 1 13 13 14 0 2 4 6 8 10 12 14 16 New York London Paris Istanbul # of taxis per thousand people Source: Statista, OECD, TomTom, Transport for London, İstanbul Büyükşehir Belediyesi, Todd W. Schneider, Hyundai Turkey, Chev rol et US, Dacia UK and Dacia France, WorldPopulationReview, CityPopulation, Transport & Environment, Salaryaftertax. Note: 1. R epr esents the lowest priced new car purchase cost in each country as of mid 2020. Maintenance and fuel costs are significant costs and are not included and net m ini mum wage salaries are used in this graph. OECD Annual Average 2020 FX rates and OECD minimum wage figures are used. 2. Based on TomTom 2021 traffic index. Indexed to London 2021 traffic congestion score. 3. Both taxis and cabs and private hire vehicles are included. Assumes no private h ire vehicles in Turkey. High traffic congestion 2 1.9x 1.1x 1.1x 1.0x 0.0 0.2 0.4 0.6 0.8 1.0 1.2 1.4 1.6 1.8 2.0 New York London Paris Istanbul Traffic congestion 2
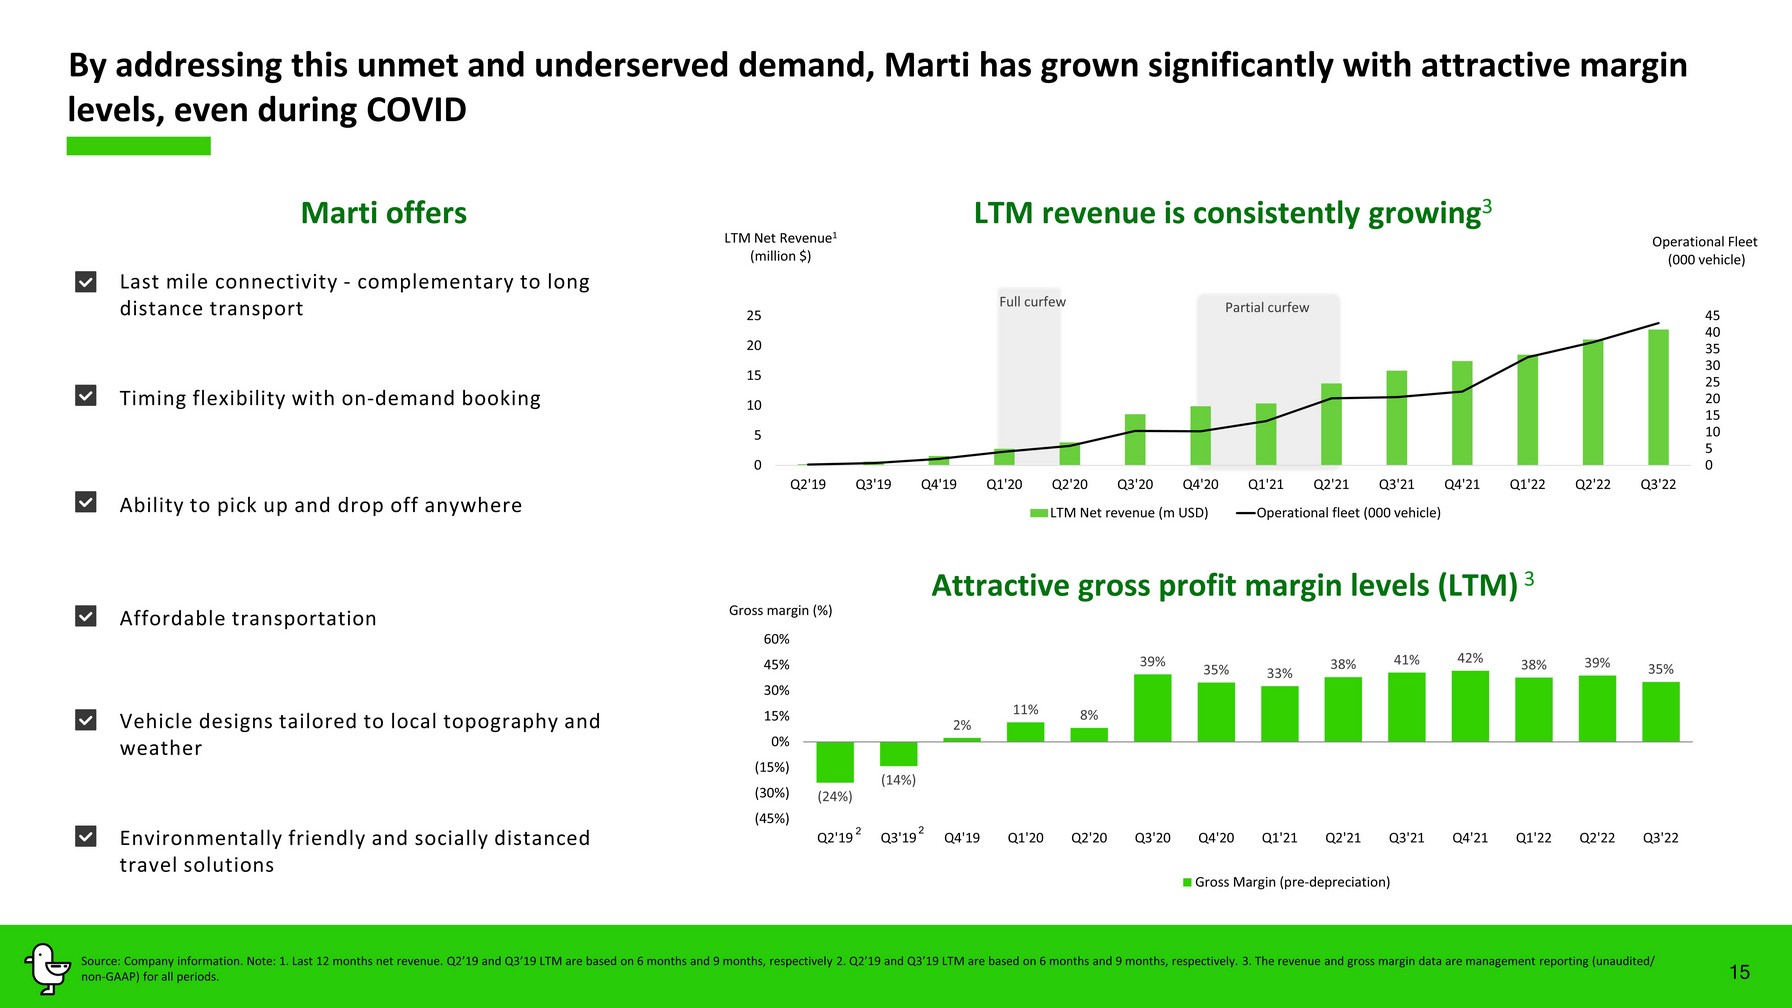
15 (24%) (14%) 2% 11% 8% 39% 35% 33% 38% 41% 42% 38% 39% 35% (45%) (30%) (15%) 0% 15% 30% 45% 60% Q2'19 Q3'19 Q4'19 Q1'20 Q2'20 Q3'20 Q4'20 Q1'21 Q2'21 Q3'21 Q4'21 Q1'22 Q2'22 Q3'22 Gross Margin (pre-depreciation) 2 Attractive gross profit margin levels (LT M) 3 By addressing this unmet and underserved demand, Marti has grown significantly with attractive margin levels, even during COVID 2 LTM revenue is consistently growing 3 Last mile connectivity - complementary to long distance transport Timing flexibility with on - demand booking Ability to pick up and drop off anywhere Affordable transportation Vehicle designs tailored to local topography and weather Environmentally friendly and socially distanced travel solutions Marti offers Source: Company information. Note: 1. Last 12 months net revenue. Q2’19 and Q3’19 LTM are based on 6 months and 9 months, res pec tively 2. Q2’19 and Q3’19 LTM are based on 6 months and 9 months, respectively. 3. The revenue and gross margin data are management reporting ( unaudited / non - GAAP) for all periods . LTM Net Revenue 1 (million $) Operational Fleet (000 vehicle) Gross margin (%) Full curfew Partial curfew 0 5 10 15 20 25 30 35 40 45 0 5 10 15 20 25 Q2'19 Q3'19 Q4'19 Q1'20 Q2'20 Q3'20 Q4'20 Q1'21 Q2'21 Q3'21 Q4'21 Q1'22 Q2'22 Q3'22 LTM Net revenue (m USD) Operational fleet (000 vehicle)
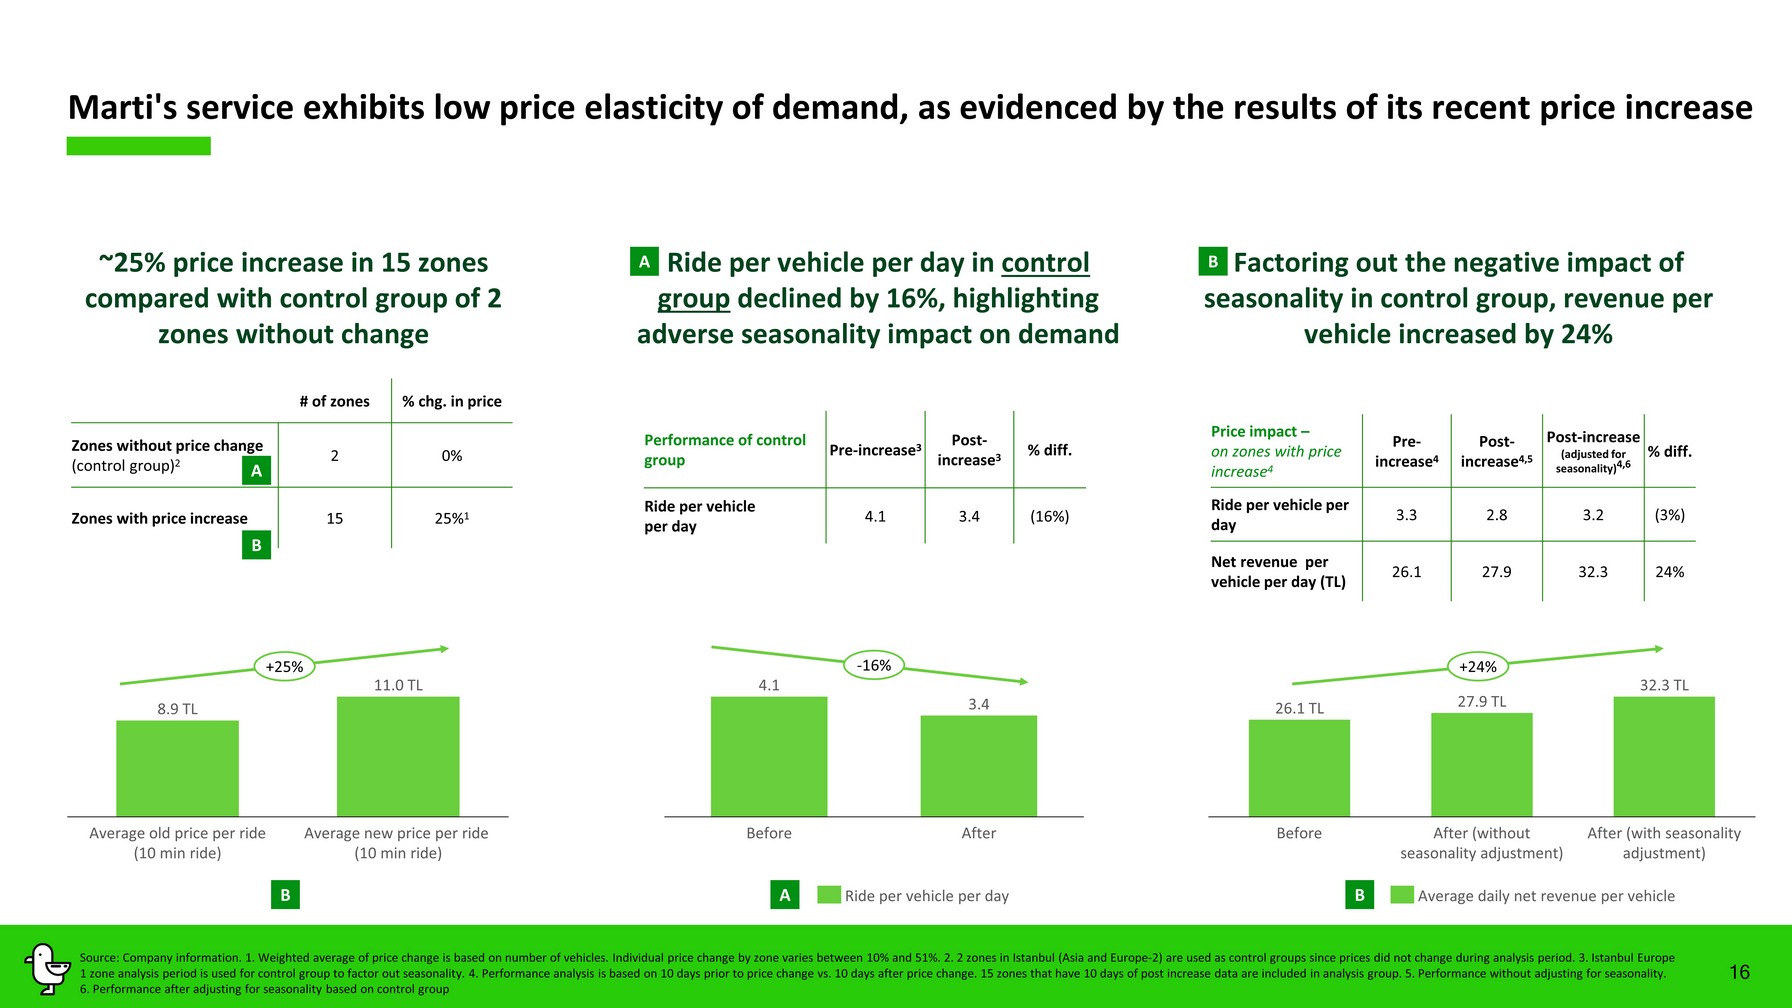
16 Source: Company information. 1. Weighted average of price change is based on number of vehicles. Individual price change by z one varies between 10% and 51%. 2. 2 zones in Istanbul (Asia and Europe - 2) are used as control groups since prices did not change d uring analysis period. 3. Istanbul Europe 1 zone analysis period is used for control group to factor out seasonality. 4. Performance analysis is based on 10 days prior to price change vs. 10 days after price change. 15 zones that have 10 days of post increase data are included in analysis group. 5 . Performance without adjusting for seasonality. 6. Performance after adjusting for seasonality based on control group # of zones % chg. in price Zones without price change (control group) 2 2 0% Zones with price increase 15 25% 1 ~25% price increase in 15 zones compared with control group of 2 zones without change Factoring out the negative impact of seasonality in control group, revenue per vehicle increased by 24% 26.1 TL 27.9 TL 32.3 TL Before After (without seasonality adjustment) After (with seasonality adjustment) Average daily net revenue per vehicle 8.9 TL 11.0 TL Average old price per ride (10 min ride) Average new price per ride (10 min ride) Price impact – on zones with price increase 4 Pre - increase 4 Post - increase 4,5 Post - increase (adjusted for seasonality) 4,6 % diff. Ride per vehicle per day 3.3 2.8 3.2 (3 % ) Net revenue per vehicle per day (TL) 26.1 27.9 32.3 24 % Ride per vehicle per day in control group declined by 16%, highlighting adverse seasonality impact on demand Performance of control group Pre - increase 3 Post - increase 3 % diff. Ride per vehicle per day 4.1 3.4 (16 % ) 4.1 3.4 Before After Ride per vehicle per day B A B A A B B +25% +2 4 % - 16 % Marti's service exhibits low price elasticity of demand, as evidenced by the results of its recent price increase
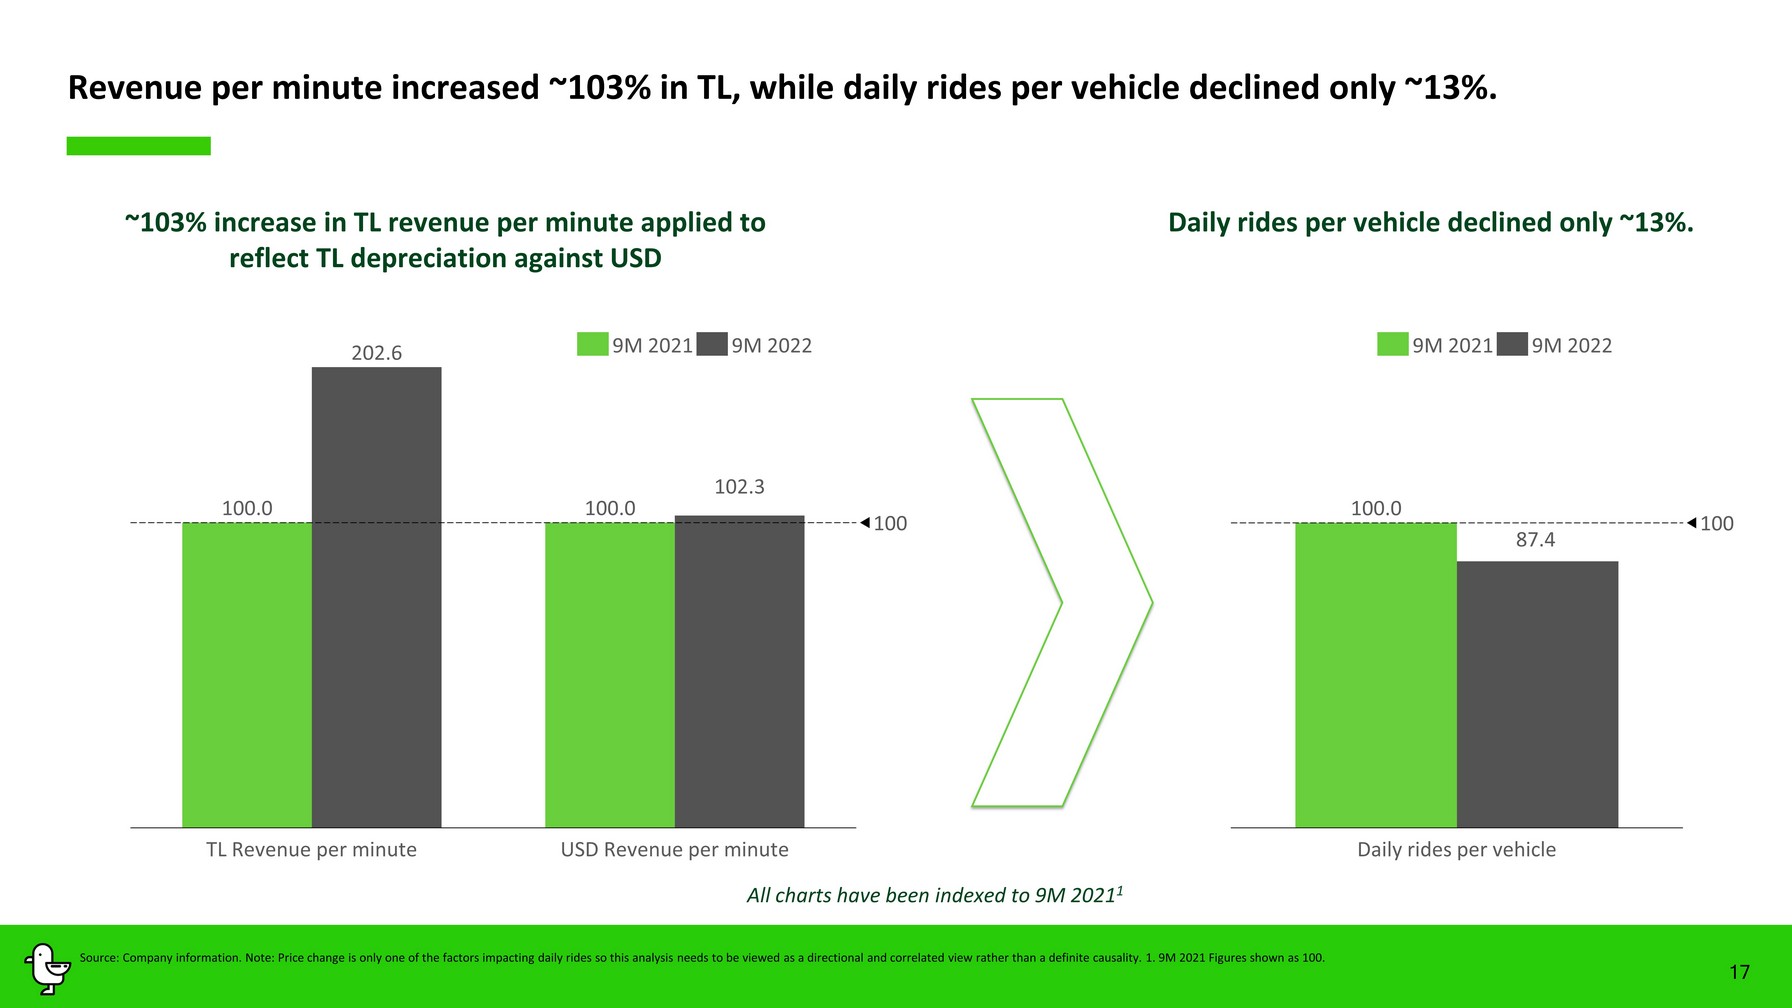
Revenue per minute increased ~ 103 % in TL, while daily rides per vehicle declined only ~ 13 % . 17 Source: Company information. Note: Price change is only one of the factors impacting daily rides so this analysis needs to be viewed as a directional and co rrelated view rather than a definite causality. 1. 9M 202 1 Figures shown as 100. 100.0 100.0 202.6 102.3 100 TL Revenue per minute USD Revenue per minute 9M 2021 9M 2022 100.0 87.4 100 Daily rides per vehicle 9M 2021 9M 2022 ~ 103 % increase in TL revenue per minute applied to reflect TL depreciation against USD Daily rides per vehicle declined only ~ 13%. All charts have been indexed to 9M 202 1 1
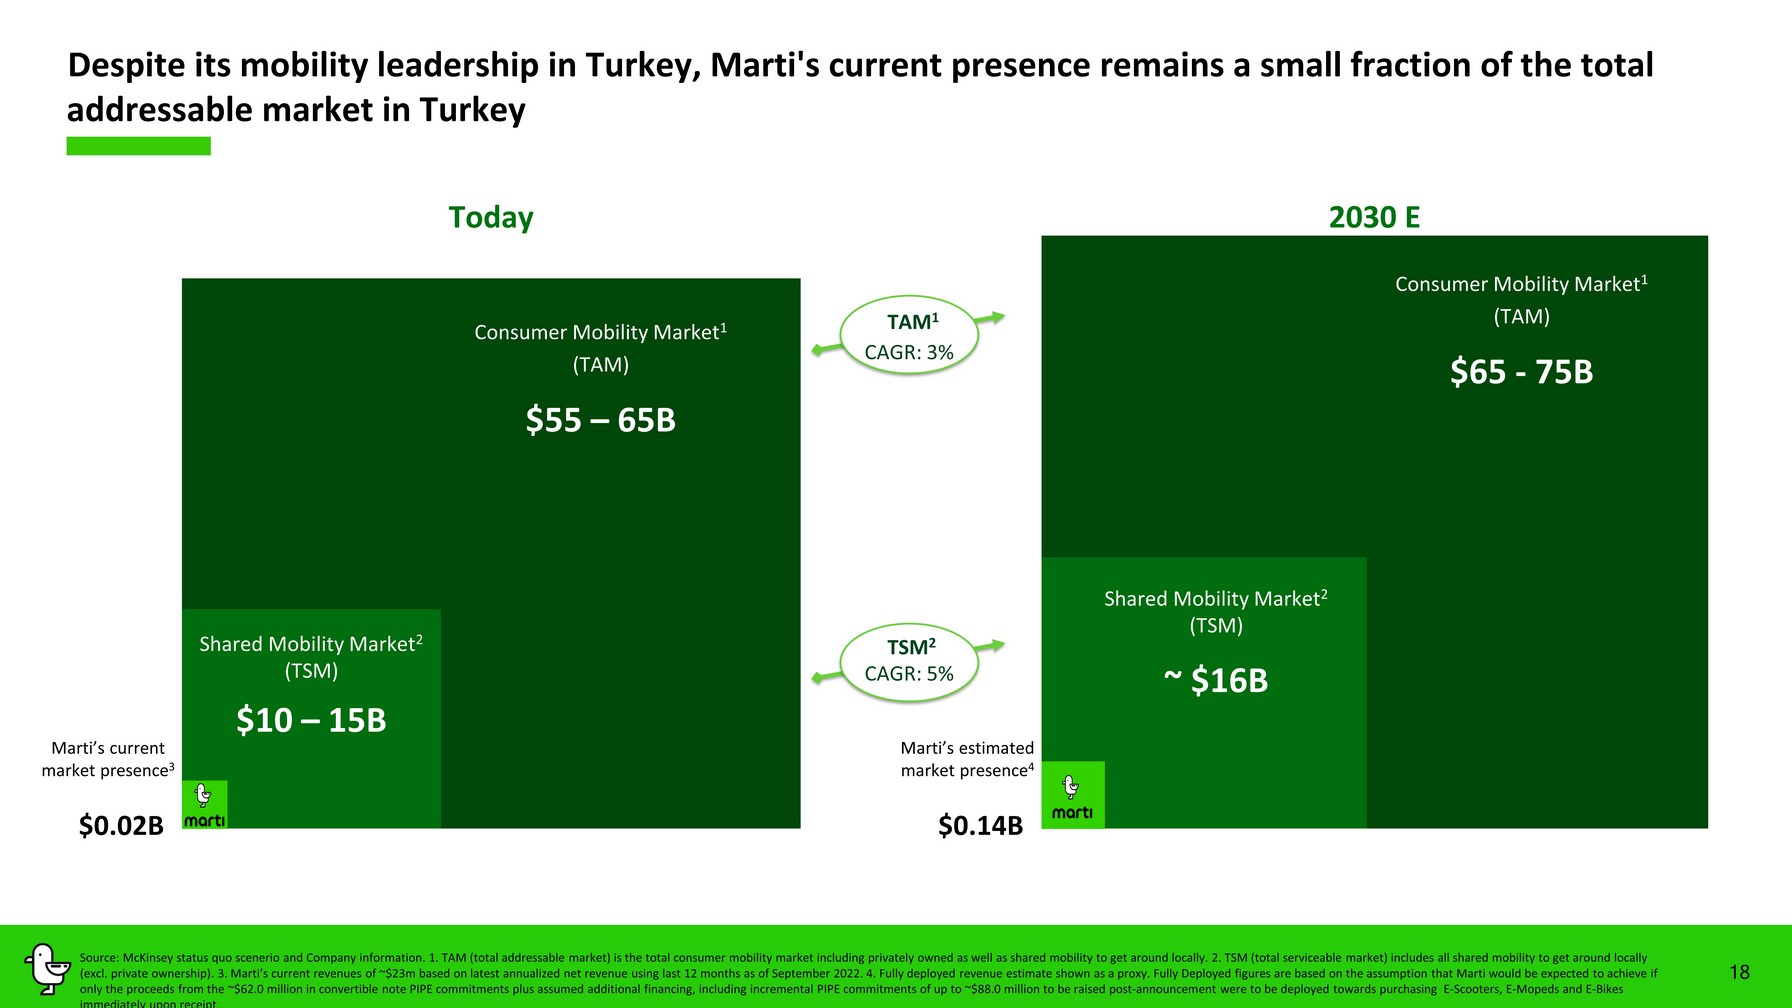
Despite its mobility leadership in Turkey, Marti's current presence remains a small fraction of the total addressable market in Turkey 18 Marti ’s current market presence 3 $0.02B $ 55 – 65 B Consumer Mobility Market 1 (TAM) Shared Mobility Market 2 (TSM) $ 10 – 15 B Marti ’s estimated market presence 4 $0.1 4 B $ 65 - 75 B Consumer Mobility Market 1 (TAM) Shared Mobility Market 2 (TSM) ~ $ 16 B Today 20 30 E Source: McKinsey status quo scenerio and Company information. 1. TAM (total addressable market) is the total consumer mobility market including privately owned as we ll as shared mobility to get around locally. 2. TSM (total serviceable market) includes all shared mobility to get around loc all y (excl. private ownership). 3. Marti’s current revenues of ~ $2 3 m based on latest annualized net revenue using last 12 months as of September 2022. 4. F ully deployed revenue estimate shown as a proxy. Fully Deployed figures are based on the assumption that Marti would be expected to achieve if only the proceeds from the ~$ 62.0 million in convertible note PIPE commitments plus assumed additional financing , including incremental PIPE commitments of up to ~$ 88.0 million to be raised post - announcement were to be deployed towards purchasing E - Scooters, E - Mopeds and E - Bikes immediately upon receipt . CAGR: 3 % TAM 1 CAGR: 5 % TSM 2
1. Highly attractive market demographics 2. Clear market leader 3. Strong customer retention, reinforced by scale 4. Vertically integrated business model driving lower costs and higher revenues 5. Strong unit economics 6. Constructive regulatory framework 7. Strong ESG fundamentals 19 Key investment highlights Source: Company information. Note: Key investment highlight #5 is in comparison to Bird and Helbiz.
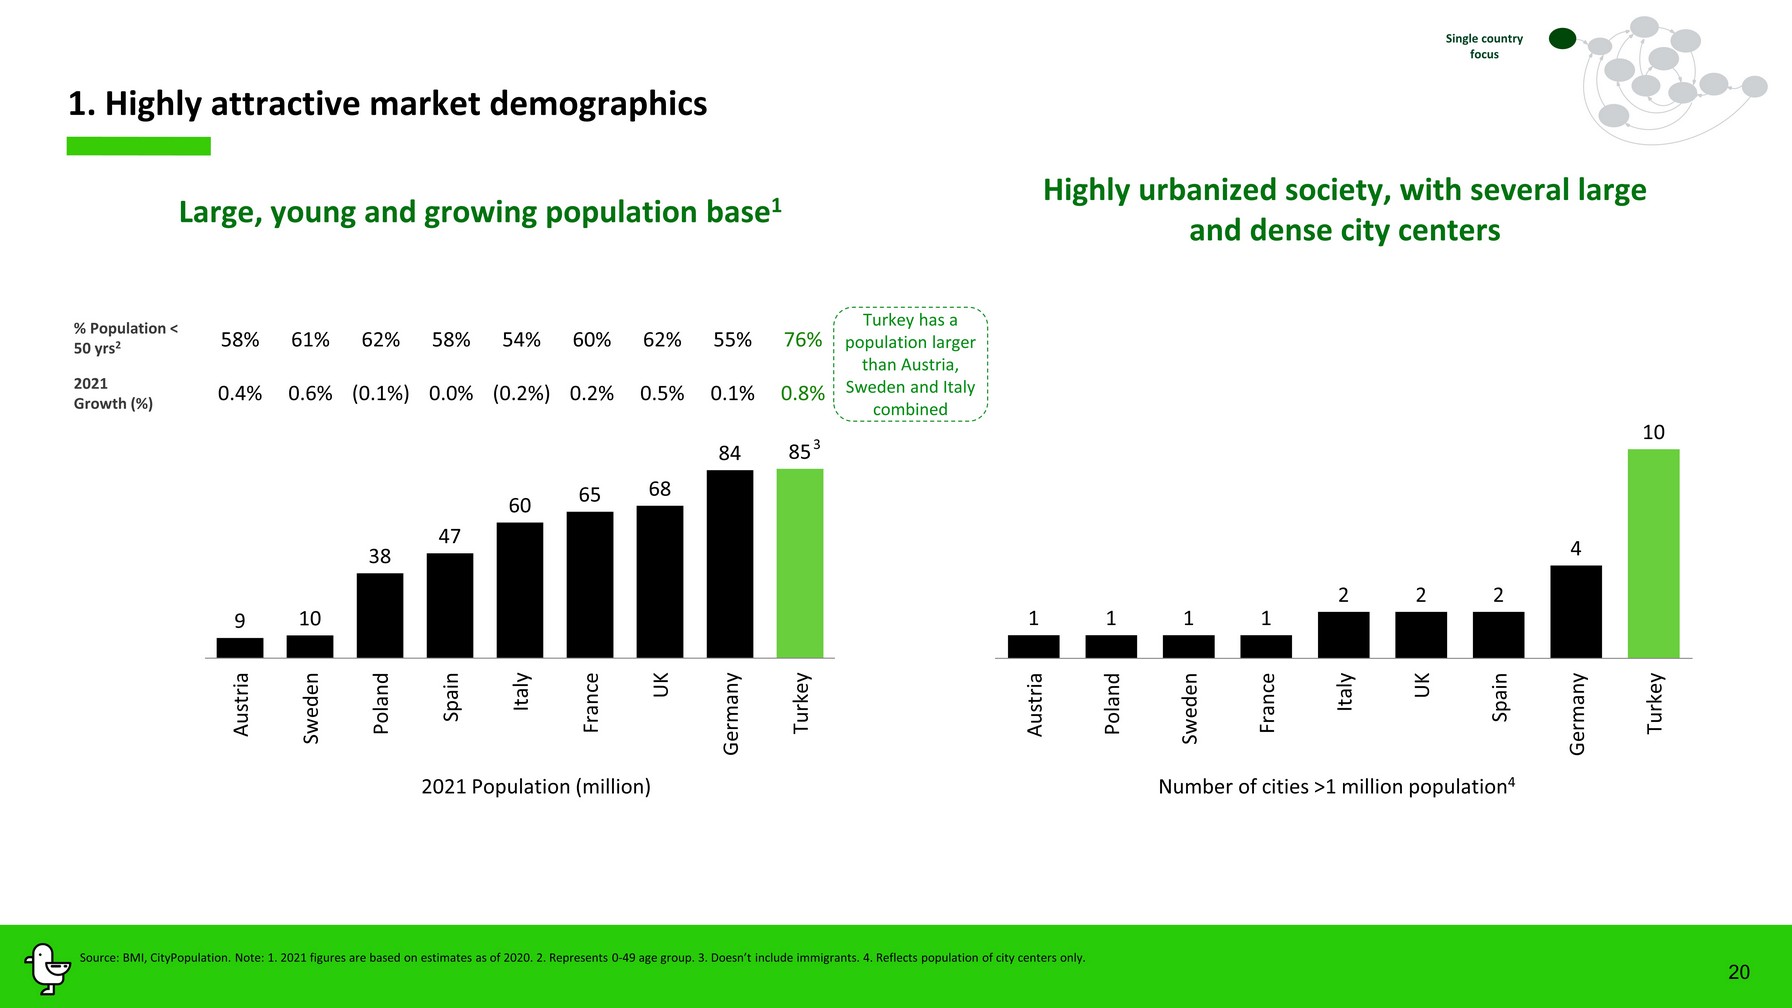
1 1 1 1 2 2 2 4 10 Austria Poland Sweden France Italy UK Spain Germany Turkey 20 1. Highly attractive market demographics 9 10 38 47 60 65 68 84 85 Austria Sweden Poland Spain Italy France UK Germany Turkey % Population < 50 yrs 2 202 1 Growth (%) 3 Source: BMI, CityPopulation. Note: 1. 2021 figures are based on estimates as of 2020. 2. Represents 0 - 49 age group. 3. Doesn’t i nclude immigrants. 4. Reflects population of city centers only. Highly urbanized society, with several large and dense city centers Single country focus Large, young and growing population base 1 202 1 Population (m illion ) Number of cities >1 million population 4 58% 61% 62% 58% 54% 60% 62% 55% 76% 0.4% 0.6% (0.1%) 0.0% (0.2%) 0.2% 0.5% 0.1% 0.8% Turkey has a population larger than Austria , Sweden and Italy combined
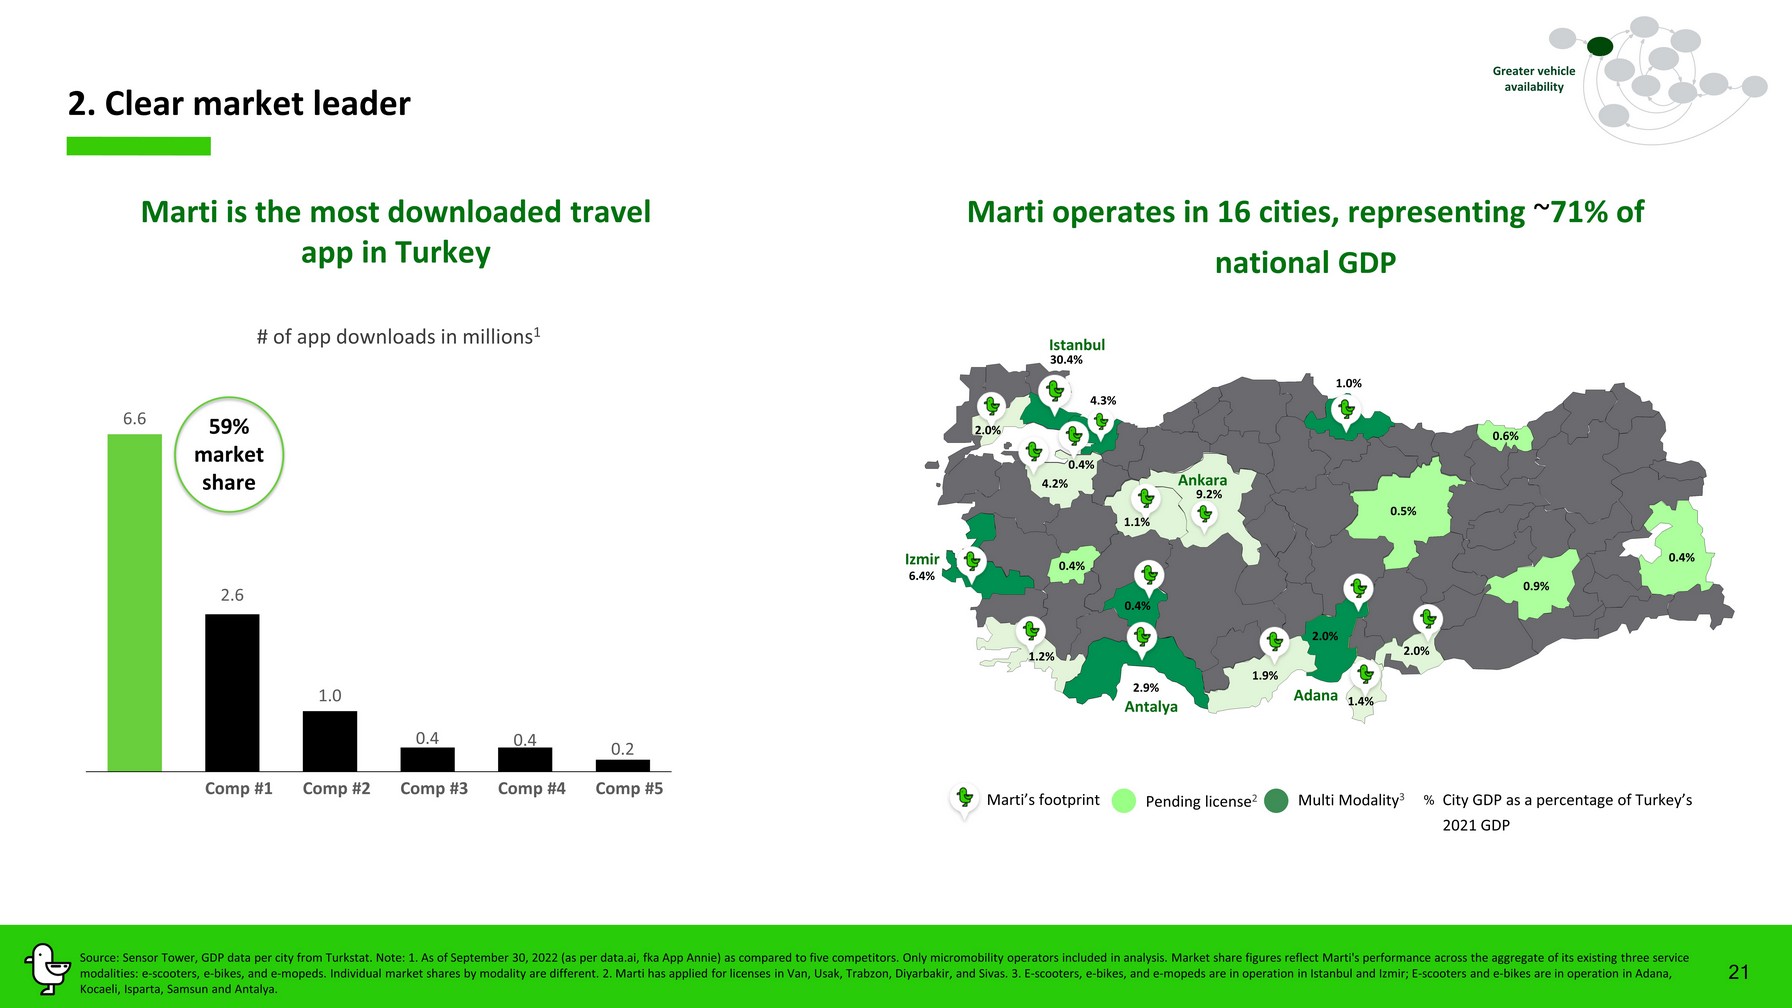
21 Source: Sensor Tower, GDP data per city from Turkstat. Note : 1. As of September 30 , 2022 (as per data.ai, fka App Annie) as compared to five competitors. Only micromobility operators included in analysis. Market share figures reflect M ar ti's performance across the aggregate of its existing three service modalities: e - scooters, e - bikes, and e - mopeds. Individual market shares by modality are different. 2 . Marti has applied for license s in Van, Usak , Trabzon, Diyarbakir, and Sivas . 3 . E - s cooters , e - bikes, and e - mopeds are in operation in Istanbul and Izmir; E - scooters and e - bikes are in operation in Adana , Kocaeli, Isparta, Samsun and Antalya. Marti is the most downloaded travel app in Turkey 59 % market share 2. Clear market leader Greater vehicle availability Marti operates in 16 cities, representing ~ 71 % of national GDP City GDP as a percentage of Turkey’s 2021 GDP % Multi Modality 3 Pending license 2 Marti ’s footprint 6.6 2.6 1.0 0.4 0.4 0.2 Comp #3 Comp #1 Comp #2 Comp #4 Comp #5 # of app downloads in millions 1 3 0 . 4 % 4 . 3 % 9. 2 % 1.0 % 2 . 9 % 1. 9 % 6. 4 % 2 . 0 % 2 . 0 % 1. 4 % 1.1% 1. 2 % 4. 2 % 0. 4 % 2 . 0 % Istanbul Izmir Ankara Antalya 0.4 % Adana 0.5 % 0.6 % 0.4 % 0.9 % 0.4 %
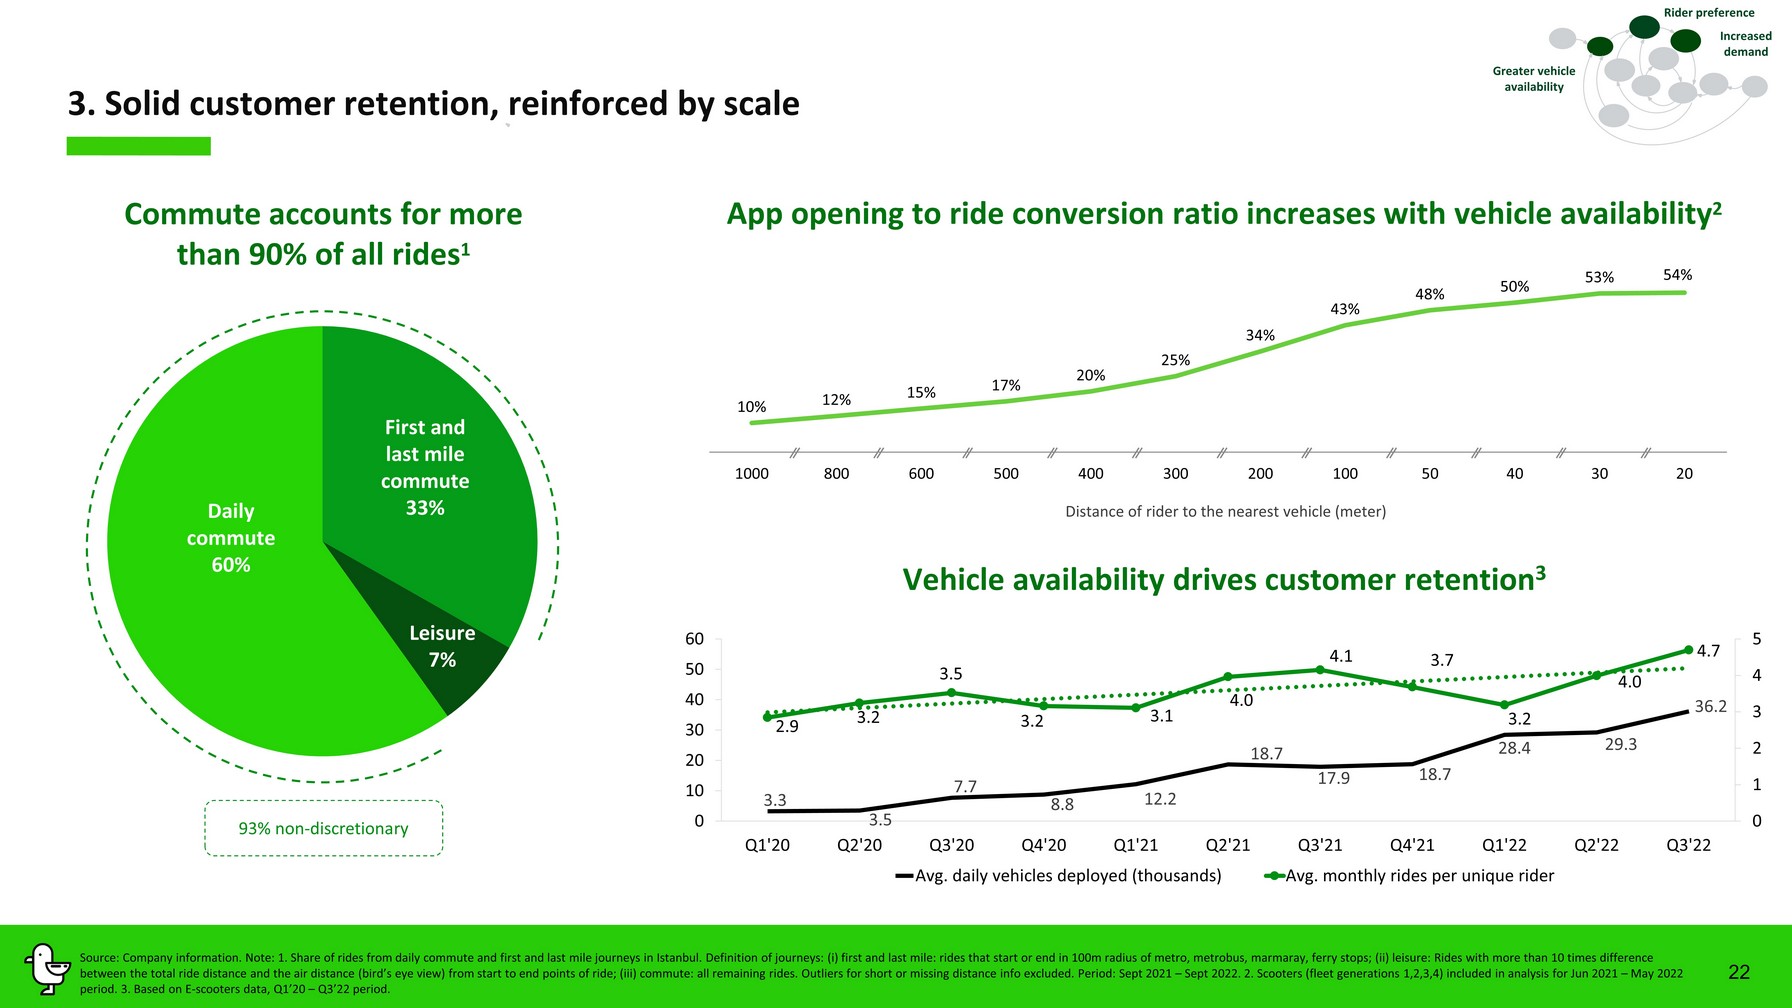
3. Solid customer retention, reinforced by scale 22 App opening to ride conversion ratio increases with vehicle availability 2 10% 12% 15% 17% 20% 25% 34% 43% 48% 50% 53% 54% 1000 800 600 500 400 300 200 100 50 40 30 20 Distance of rider to the nearest vehicle (m eter ) Rider preference Increased demand Commute accounts for more than 9 0 % of all rides 1 Source: Company information. Note: 1. Share of rides from daily commute and first and last mile journeys in Istanbul. Definit ion of journeys: ( i ) first and last mile: rides that start or end in 100m radius of metro, metrobus, marmaray , ferry stops; (ii) leisure: Rides with more than 10 times difference between the total ride distance and the air distance (bird’s eye view) from start to end points of ride ; (iii) commute: all remaining rides. Outliers for short or missing distance info excluded. Period: Sept 2021 – Sept 2022. 2. Scooters (fleet generations 1,2,3,4) included in analysis for Jun 2021 – May 2022 period. 3. Based on E - scooters data, Q1’20 – Q3’22 period. 9 3 % non - discretionary Greater vehicle availability Daily commute 6 0 % First and last mile commute 3 3 % Leisure 7 % Vehicle availability drives customer retention 3 3.3 3.5 7.7 8.8 12.2 18.7 17.9 18.7 28.4 29.3 36.2 2.9 3.2 3.5 3.2 3.1 4.0 4.1 3.7 3.2 4.0 4.7 0 1 2 3 4 5 0 10 20 30 40 50 60 Q1'20 Q2'20 Q3'20 Q4'20 Q1'21 Q2'21 Q3'21 Q4'21 Q1'22 Q2'22 Q3'22 Avg. daily vehicles deployed (thousands) Avg. monthly rides per unique rider
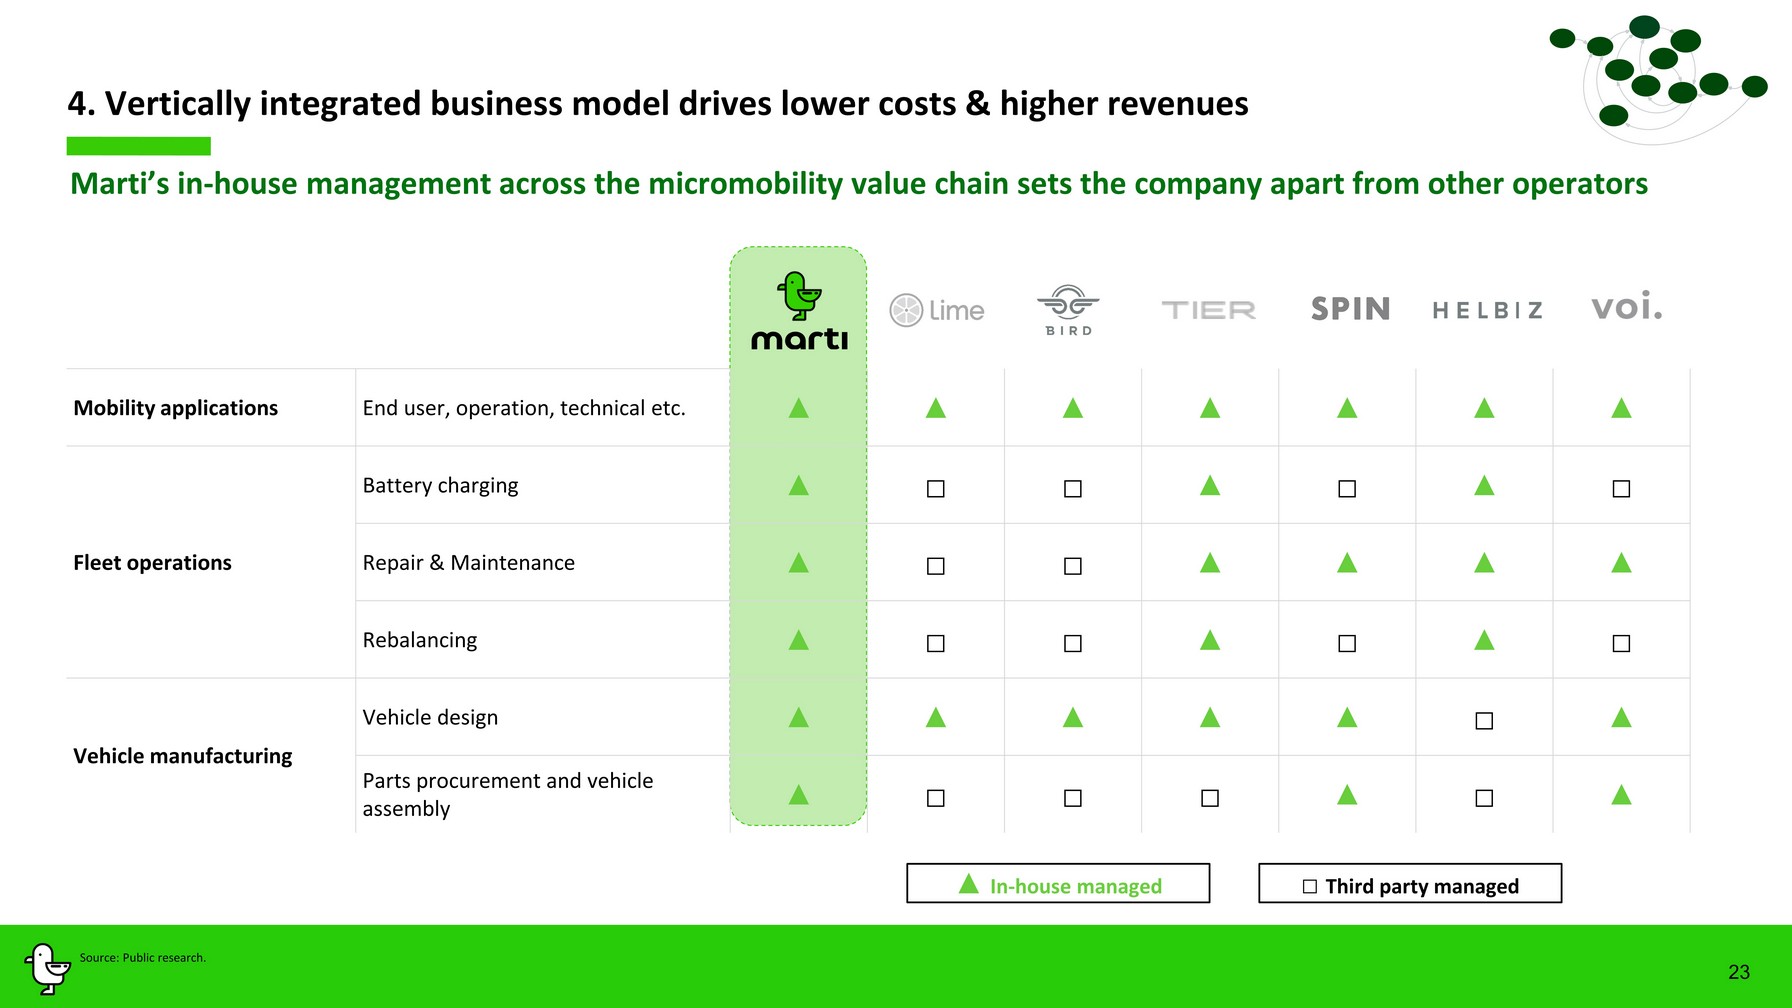
23 4. Vertically integrated business model drives lower costs & higher revenues Mobility applications End user, operation, technical etc. ▲ ▲ ▲ ▲ ▲ ▲ ▲ Fl eet operations Battery c harging ▲ □ □ ▲ □ ▲ □ Repair & M aint e n a nce ▲ □ □ ▲ ▲ ▲ ▲ Re balancing ▲ □ □ ▲ □ ▲ □ V ehicle manufacturing Vehicle de sign ▲ ▲ ▲ ▲ ▲ □ ▲ Parts procurement and vehicle assembly ▲ □ □ □ ▲ □ ▲ Marti ’s in - house management across the micromobility value chain sets the company apart from other operators Source: Public research. ▲ I n - house managed □ Third party managed
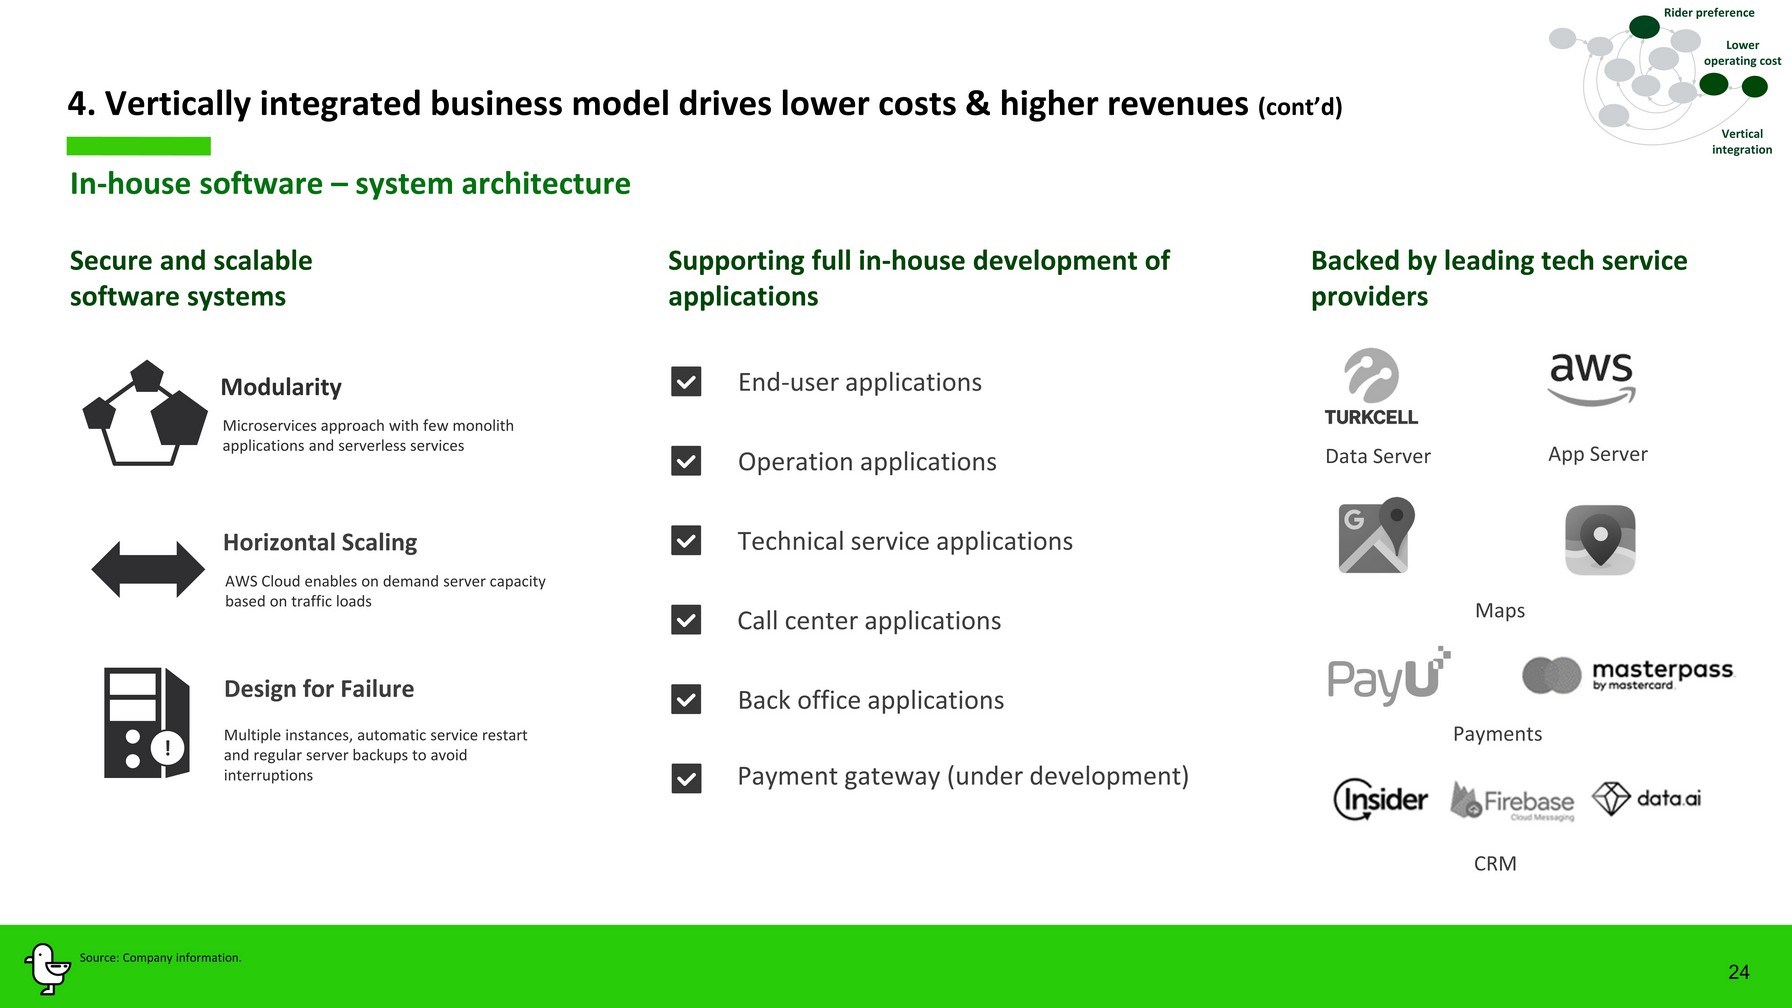
24 Maps Payments App Server Data Server Design for Failure ! Horizontal Scaling Secure and scalable software syste ms Multiple instances, automatic service restart and regular server backups to avoid interruptions S upporting full in - house development of applications Backed by leading tech service providers Modularity Microservices approach with few monolith applications and serverless services AWS Cloud enables on demand server capacity based on traffic loads 4. Vertically integrated business model drives lower costs & higher revenues (cont’d) In - house software – system architecture Vertical integration Source: Company information. Rider preference Back office application s Technical service application s Operation application s Call cente r application s End - user application s Payment gateway (under development) Lower operating cost CRM
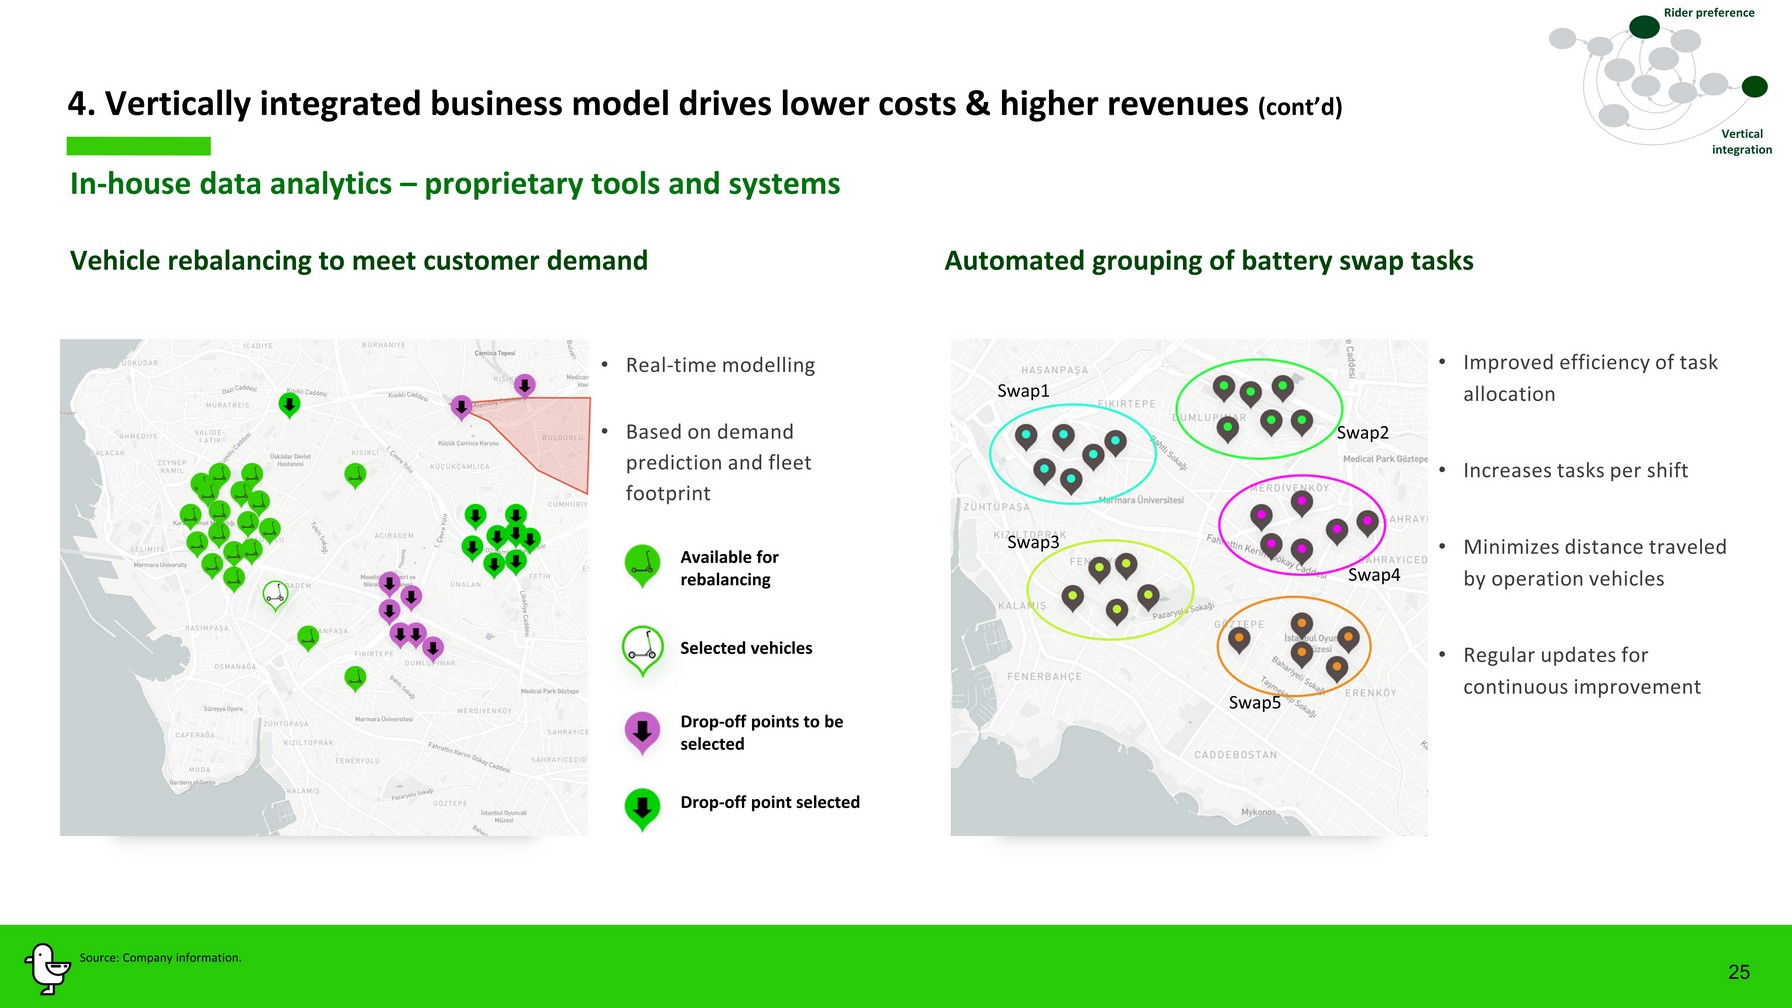
25 In - house data analytics – p roprietary tools and systems 4. Vertically integrated business model drives lower costs & higher revenues (cont’d) Vehicle rebalancing to meet customer demand Automated grouping of battery swap tasks Swap1 Swap3 Swap5 Swap4 Swap2 Vertical integration • Real - time modelling • Based on demand prediction and fleet footprint • Improved efficiency of task allocation • Increases tasks per shift • Minimizes distance traveled by operation vehicles • Regular updates for continuous improvement Available for rebalancing Selected vehicles Drop - off points to be selected Drop - off point selected Source: Company information. Rider preference
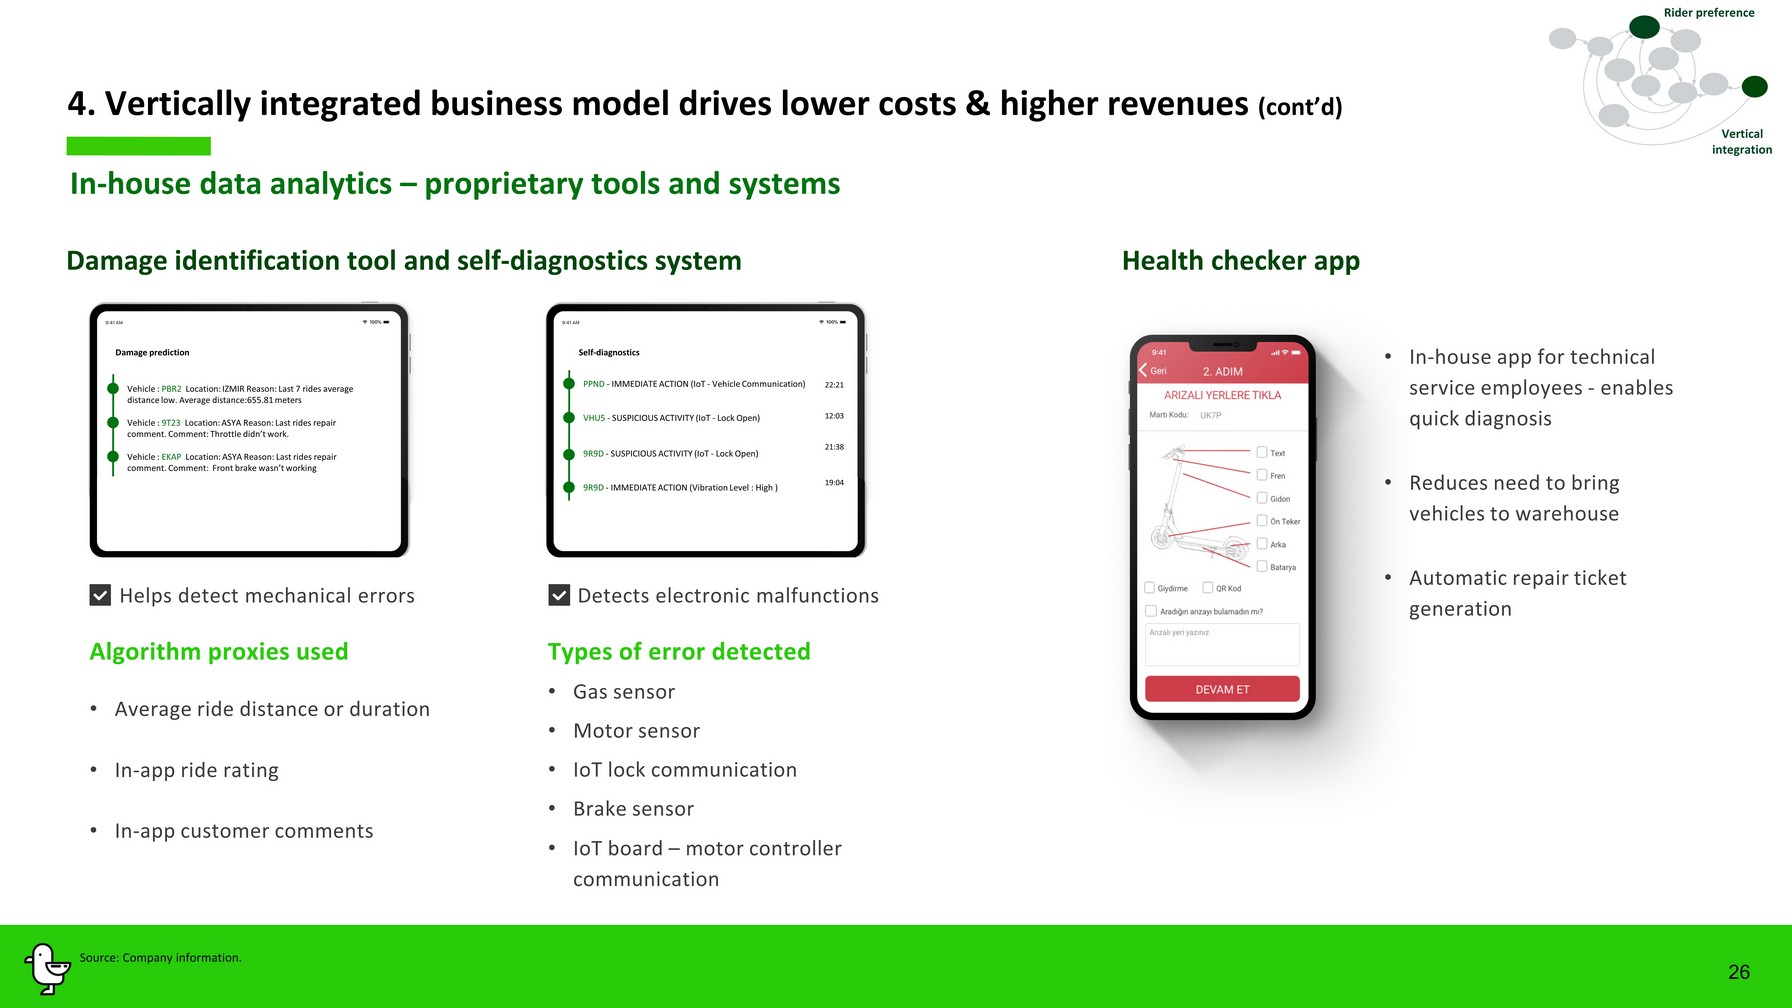
26 4. Vertically integrated business model drives lower costs & higher revenues (cont’d) Vertical integration Damage identification tool and self - diagnostics system Health checker app Vehicle : PBR2 Location: IZMIR Reason: Last 7 rides average distance low. Average distance: 655.81 meters Vehicle : 9T23 Location: ASYA Reason: Last rides repair comment. Comment: Throttle didn’t work. Vehicle : EKAP Location: ASYA Reason: Last rides repair comment. Comment: Front brake wasn’t working Damage prediction PPND - IMMEDIATE ACTION (IoT - Vehicle Communication) VHU5 - SUSPICIOUS ACTIVITY (IoT - Lock Open) 9R9D - SUSPICIOUS ACTIVITY (IoT - Lock Open) 9R9D - IMMEDIATE ACTION (Vibration Level : High ) 22:21 12:03 21:38 19:04 Self - diagnostics • In - house app for technical service employees - enables quick diagnosis • Reduces need to bring vehicles to warehouse • Automatic repair ticket generation Types of error detected • Gas sensor • Motor sensor • Brake sensor • IoT lock communication • IoT board – motor controller communication Algorithm proxies used • Average ride distance or duration • In - app ride rating • In - app customer comments Helps detect mechanical errors Detects electronic malfunctions In - house data analytics – p roprietary tools and systems Source: Company information. Rider preference
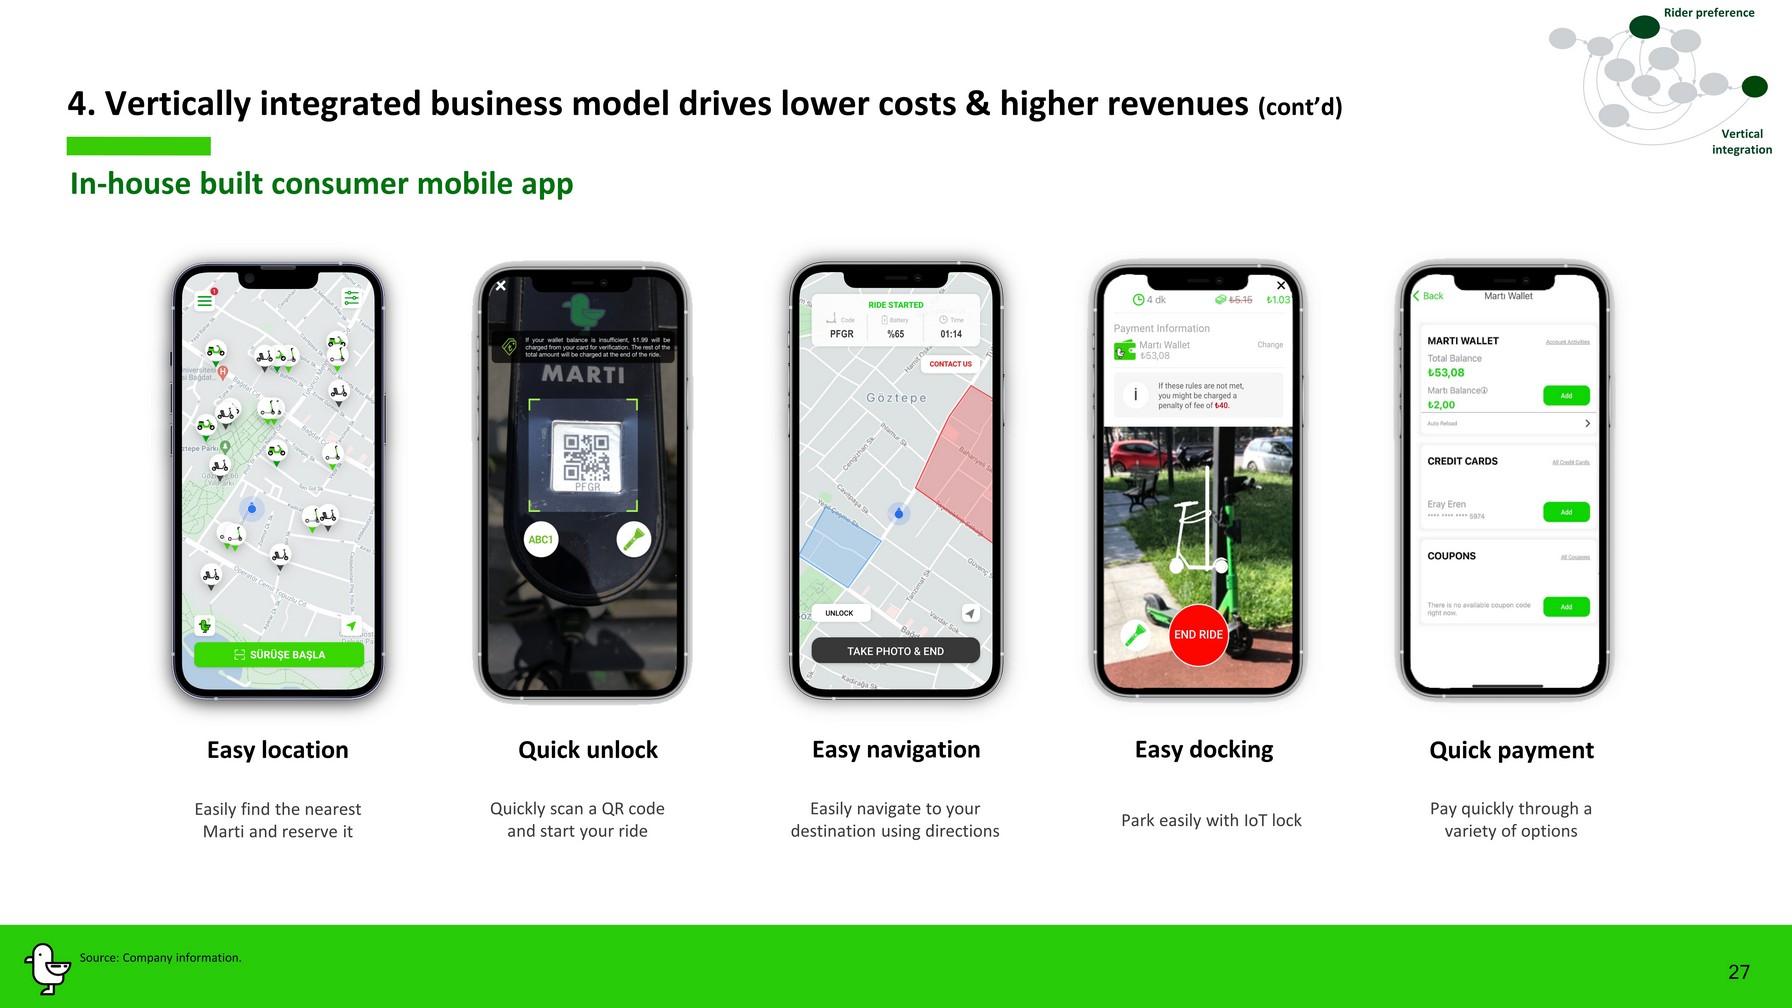
In - house built consumer mobile app 4. Vertically integrated business model drives lower costs & higher revenues (cont’d) Vertical integration Easily find the nearest Marti and reserve it Quickly scan a QR code and start your ride Easily navigate to your destination using directions Park easily with IoT lock Pay quickly through a variety of options Quick unlock Easy navigation Easy docking Quick payment 27 Rider preference Source: Company information. PFGR %65 01:14 Easy location
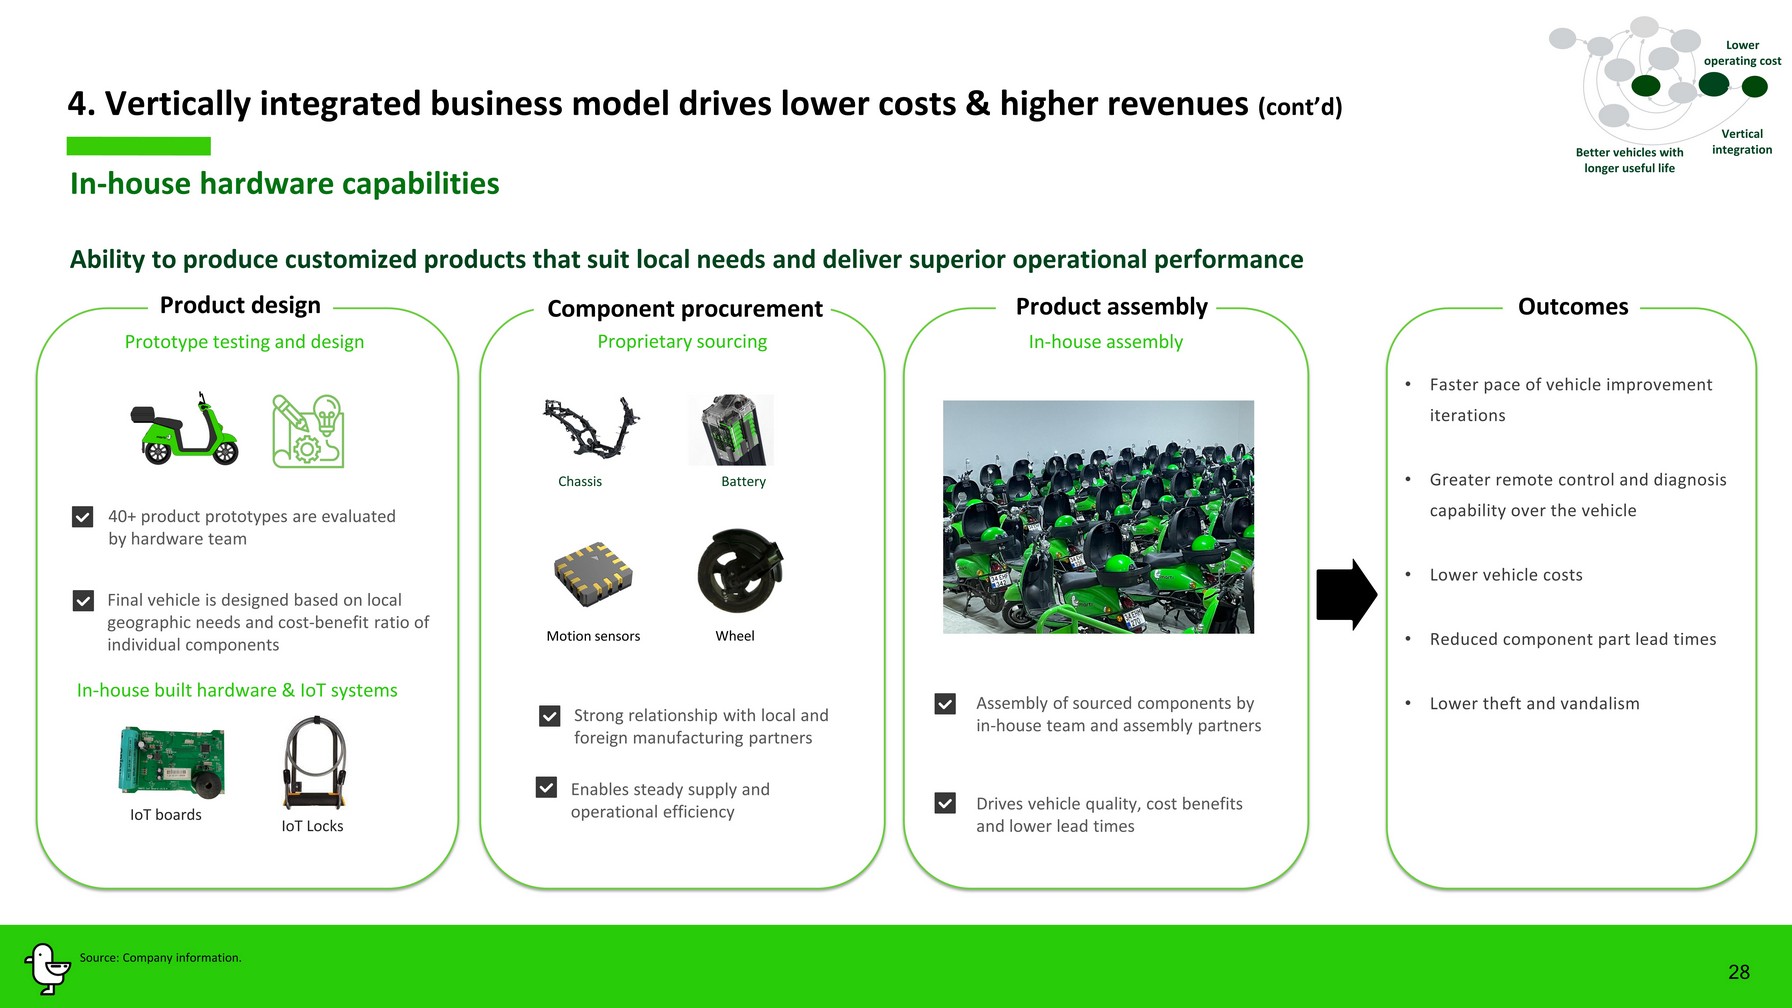
28 Ability to produce customized products that suit local needs and deliver superior operational performance In - house hardware capabilities Final vehicle is designed based on local geographic needs and cost - benefit ratio of individual components 40+ product prototypes are evaluated by hardware team Wheel Chassis Battery Motion sensors In - house built hardware & IoT systems IoT boards IoT Locks Strong relationship with local and foreign manufacturing partners Enables steady supply and operational efficiency Assembly of sourced components by in - house team and assembly partners Drives vehicle quality, cost benefits and lower lead times 4. Vertically integrated business model drives lower costs & higher revenues (cont’d) Vertical integration Better vehicles with longer useful life • Faster pace of vehicle improvement iterations • Greater remote control and diagnosis capability over the vehicle • Lower vehicle costs • Reduced component part lead times • Lower theft and vandalism Source: Company information. Lower operating cost Product assembly Product design Prototype testing and design Component procurement Outcomes Proprietary sourcing In - house assembly
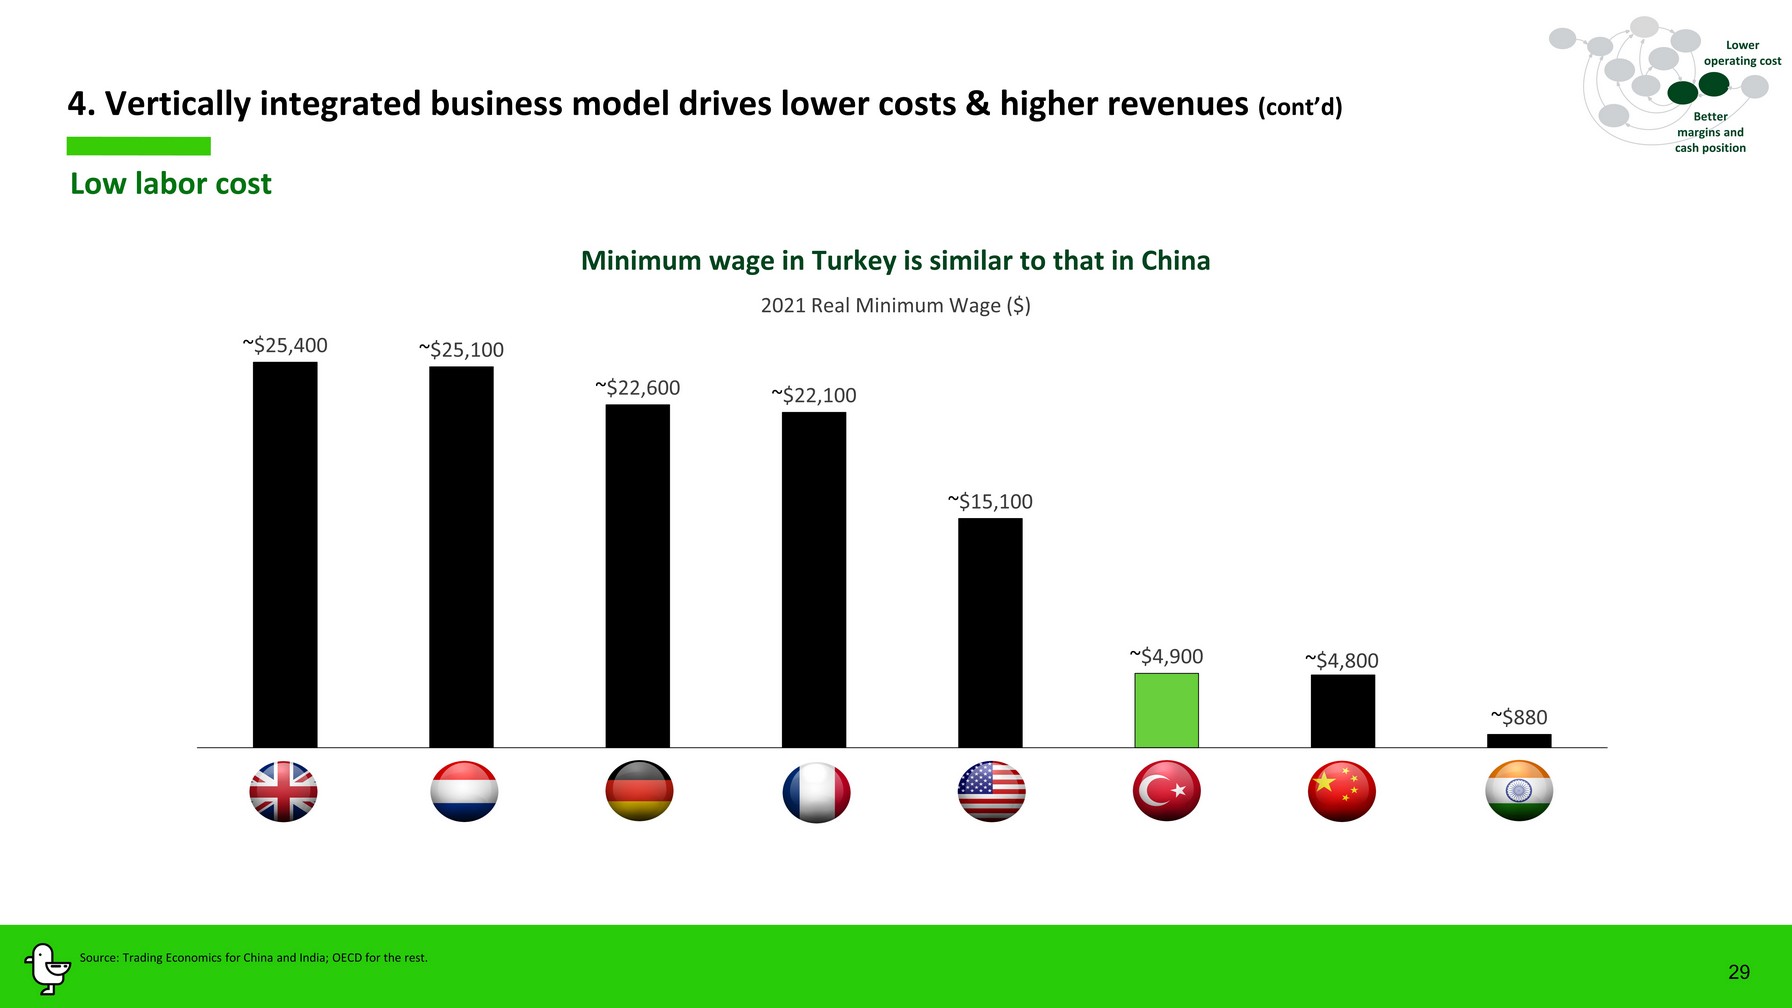
29 Low labor cost 4. Vertically integrated business model drives lower costs & higher revenues (cont’d) Better margins and cash position Source: Trading Economics for China and India; OECD for the rest. 202 1 Real Minimum Wage ($) Minimum wage in Turkey is similar to that in China ~ $25,400 ~ $25,100 ~ $22,600 ~ $22,100 ~ $15,100 ~ $4,900 ~ $4,800 ~ $ 880 Lower operating cost
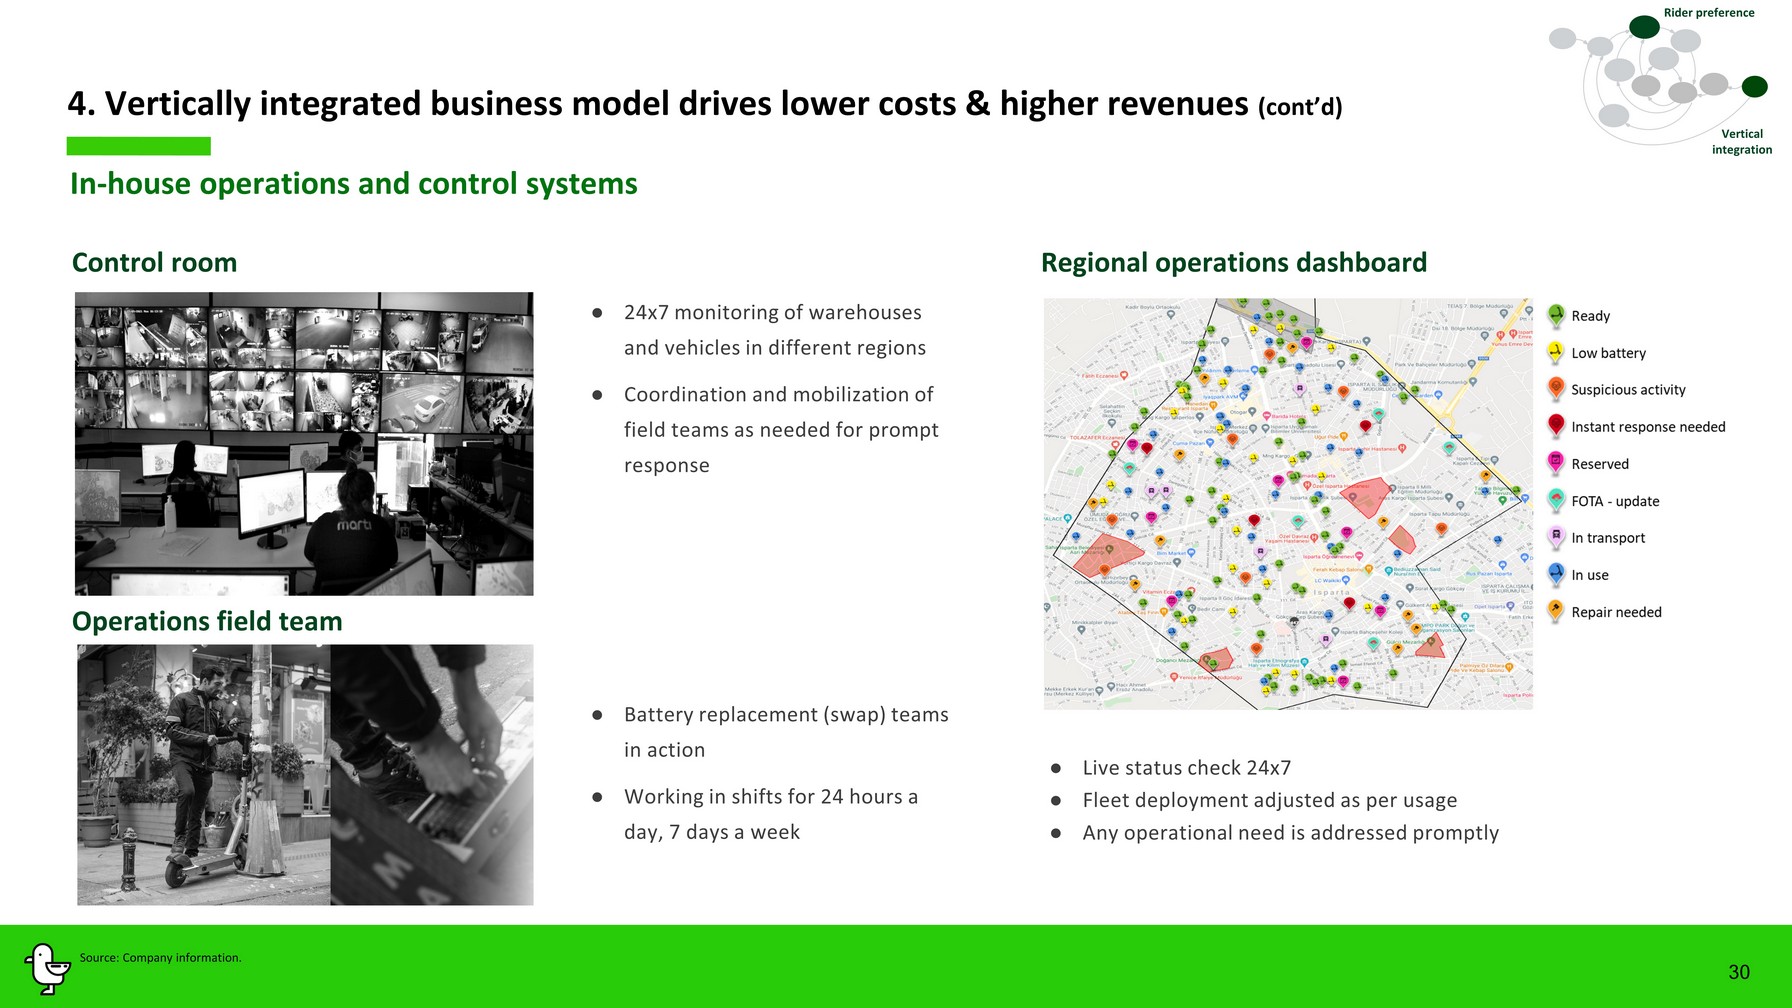
Control room 30 ● Live status check 24x7 ● Fleet deployment adjusted as per usage ● Any operational need is addressed promptly ● 24x7 monitoring of warehouses and vehicles in different regions ● Coordination and mobilization of field teams as needed for prompt response ● Battery replacement (swap) teams in action ● Working in shifts for 24 hours a day , 7 days a week In - house operations and control systems Operations field team Regional operations dashboard 4. Vertically integrated business model drives lower costs & higher revenues (cont’d) Vertical integration Source: Company information. Rider preference
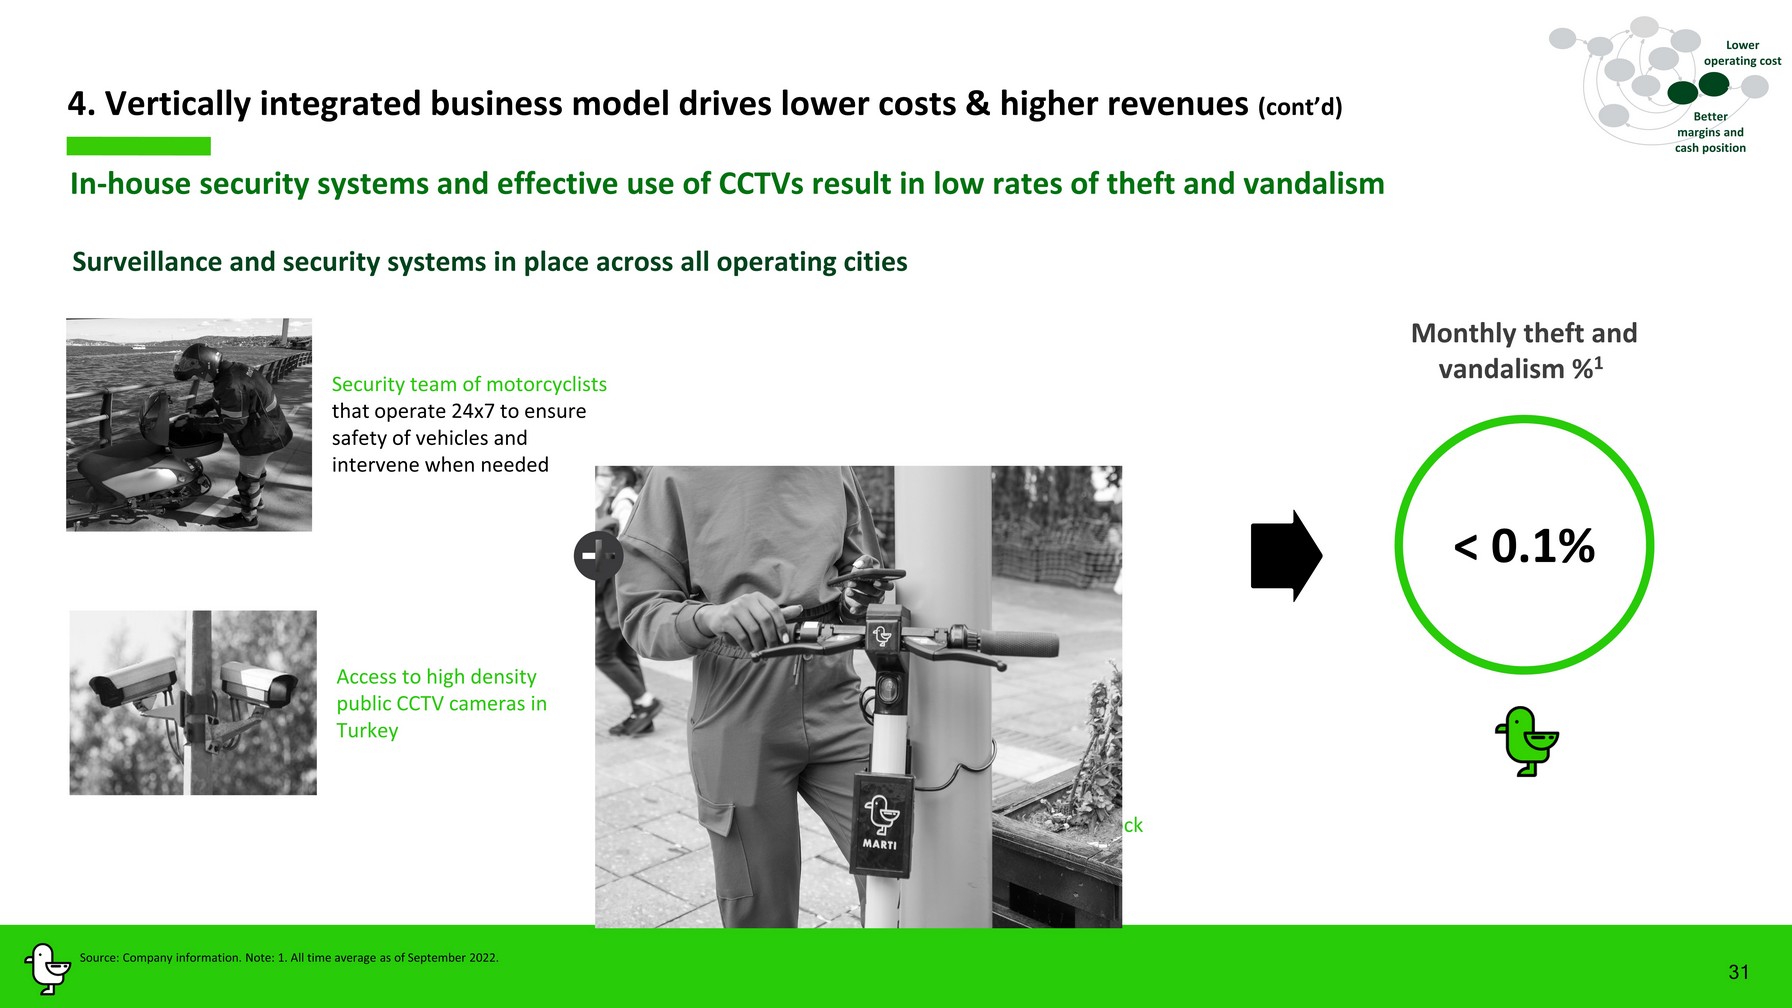
In - house security systems and effective use of CCTVs result in low rates of t heft and vandalism 4. Vertically integrated business model drives lower costs & higher revenues (cont’d) Surveillance and security systems in place across all operating cities 31 Marti ’s innovative physical IoT based cable lock Security team of motorcyclists that operate 24x7 to ensure safety of vehicles and intervene when needed Access to high density public CCTV cameras in Turke y < 0.1% Better margins and cash position Source: Company information. Note: 1. All time average as of September 2022. Monthly theft and vandalism % 1 Lower operating cost
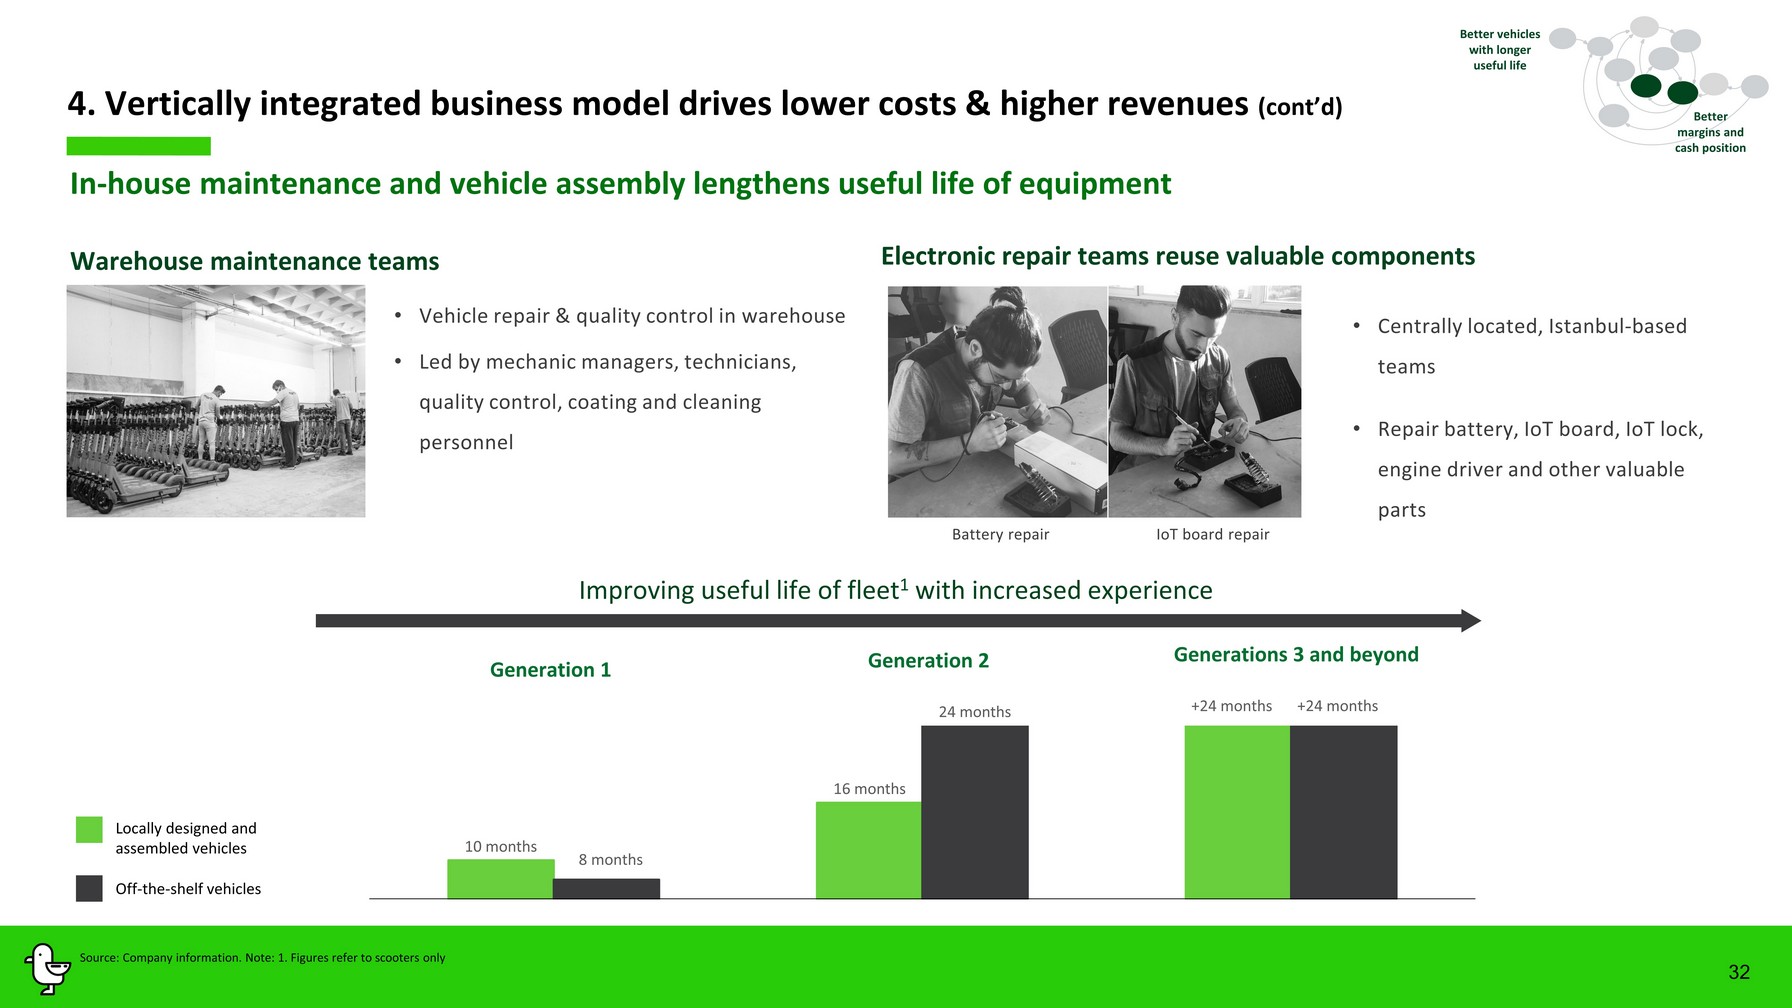
• Centrally located, Istanbul - based teams • Repair battery, IoT board, IoT lock, engine driver and other valuable parts In - house maintenance and vehicle assembly lengthens useful life of equipment Electronic repair teams reuse valuable components 32 Warehouse maintenance teams • Vehicle repair & quality control in warehouse • Led by mechanic managers, technicians, quality control, coating and cleaning personnel Battery repair IoT board repair Improving useful life of fleet 1 with increased experience Better margins and cash position Generations 3 and beyond Generation 1 Generation 2 8 months + 24 months + 24 months Off - the - shelf vehicles 4. Vertically integrated business model drives lower costs & higher revenues (cont’d) Locally designed and assembled vehicles Better vehicles with longer useful life Source: Company information. Note: 1. Figures refer to scooters only 10 months 16 months 24 months
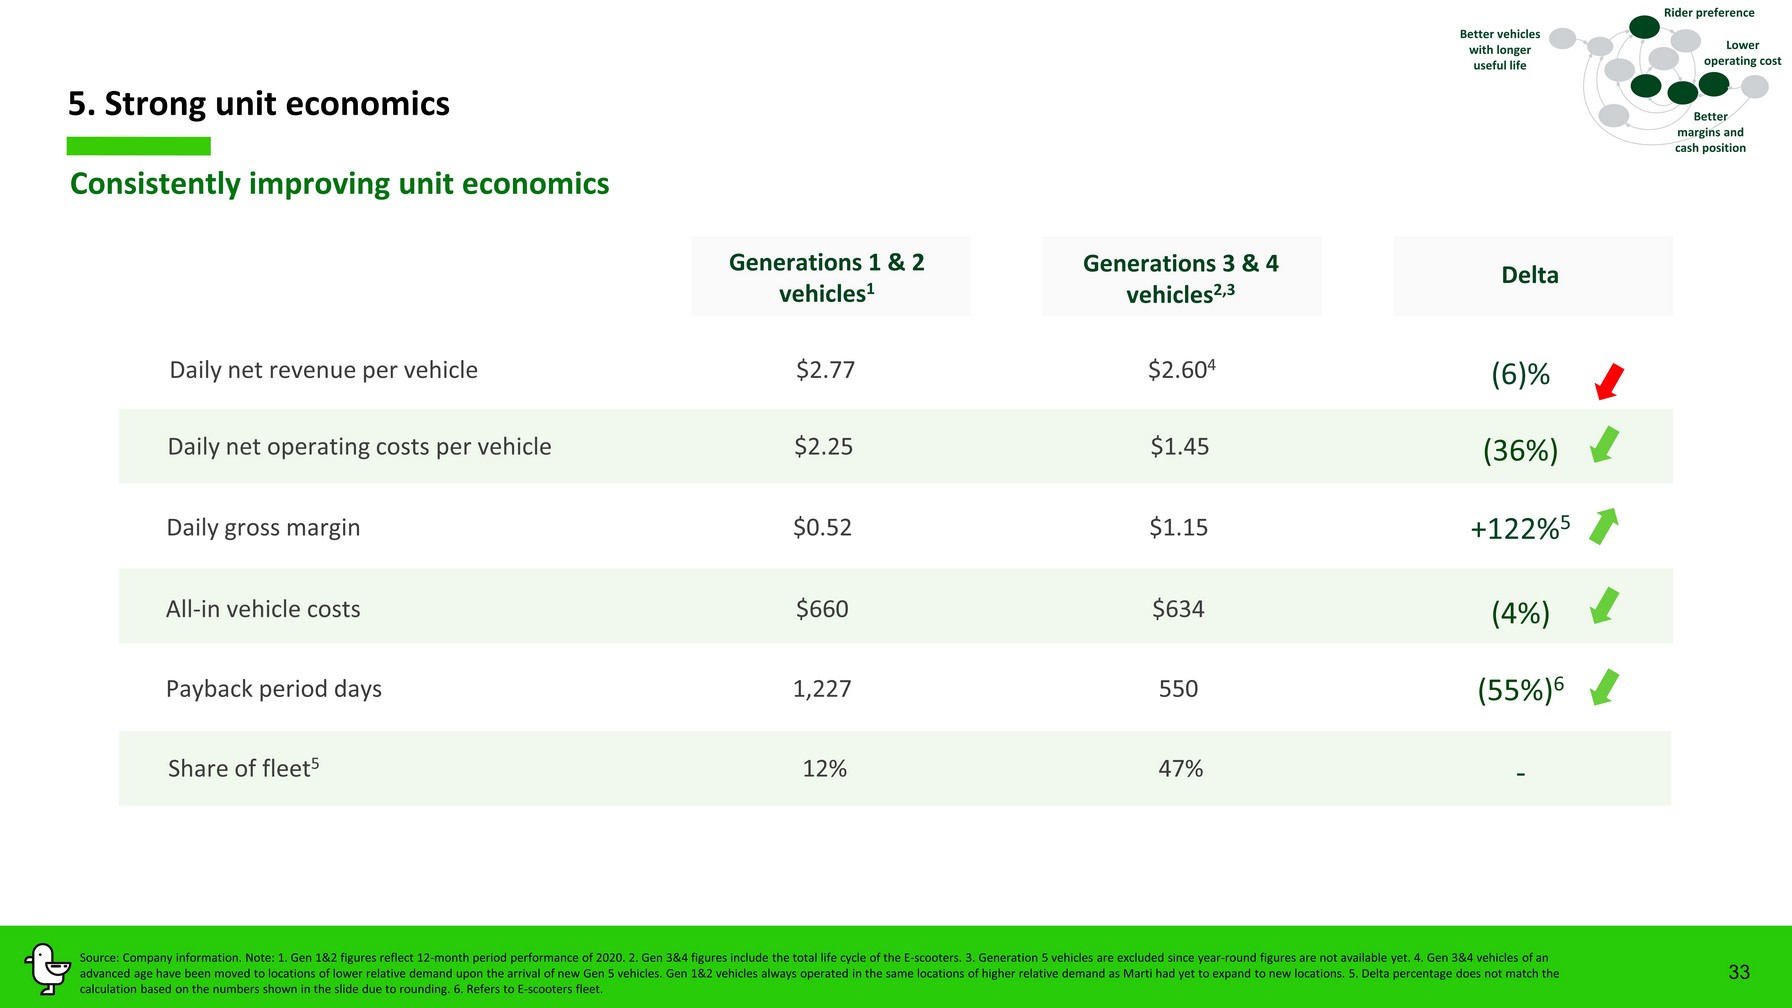
33 Consistently improving unit economics + 122 % 5 Generations 3 & 4 vehicles 2 ,3 Generations 1 & 2 vehicles 1 Delta Daily net revenue per vehicle $2.77 $ 2 . 60 4 Daily net operating costs per vehicle $2.25 $1. 4 5 Daily gross margin $0.52 $1. 1 5 All - in vehicle costs $660 $63 4 Payback period days 1,227 5 50 Share of fleet 5 1 2 % 47 % (6) % ( 36 %) ( 4 %) ( 5 5 %) 6 - 5. Strong unit economics Better vehicles with longer useful life Rider preference Source: Company information. Note: 1. Gen 1&2 figures reflect 12 - month period performance of 2020 . 2. Gen 3&4 figures include the total life cycle of the E - scooters. 3. Generation 5 vehicles are excluded since year - round figu res are not available yet. 4. Gen 3&4 vehicles of an advanced age have been moved to locations of lower relative demand upon the arrival of new Gen 5 vehicles. Gen 1&2 vehicles a lwa ys operated in the same locations of higher relative demand as Marti had yet to expand to new locations. 5. Delta percentage doe s not match the calculation based on the numbers shown in the slide due to rounding. 6. Refers to E - scooters fleet. Better margins and cash position Lower operating cost
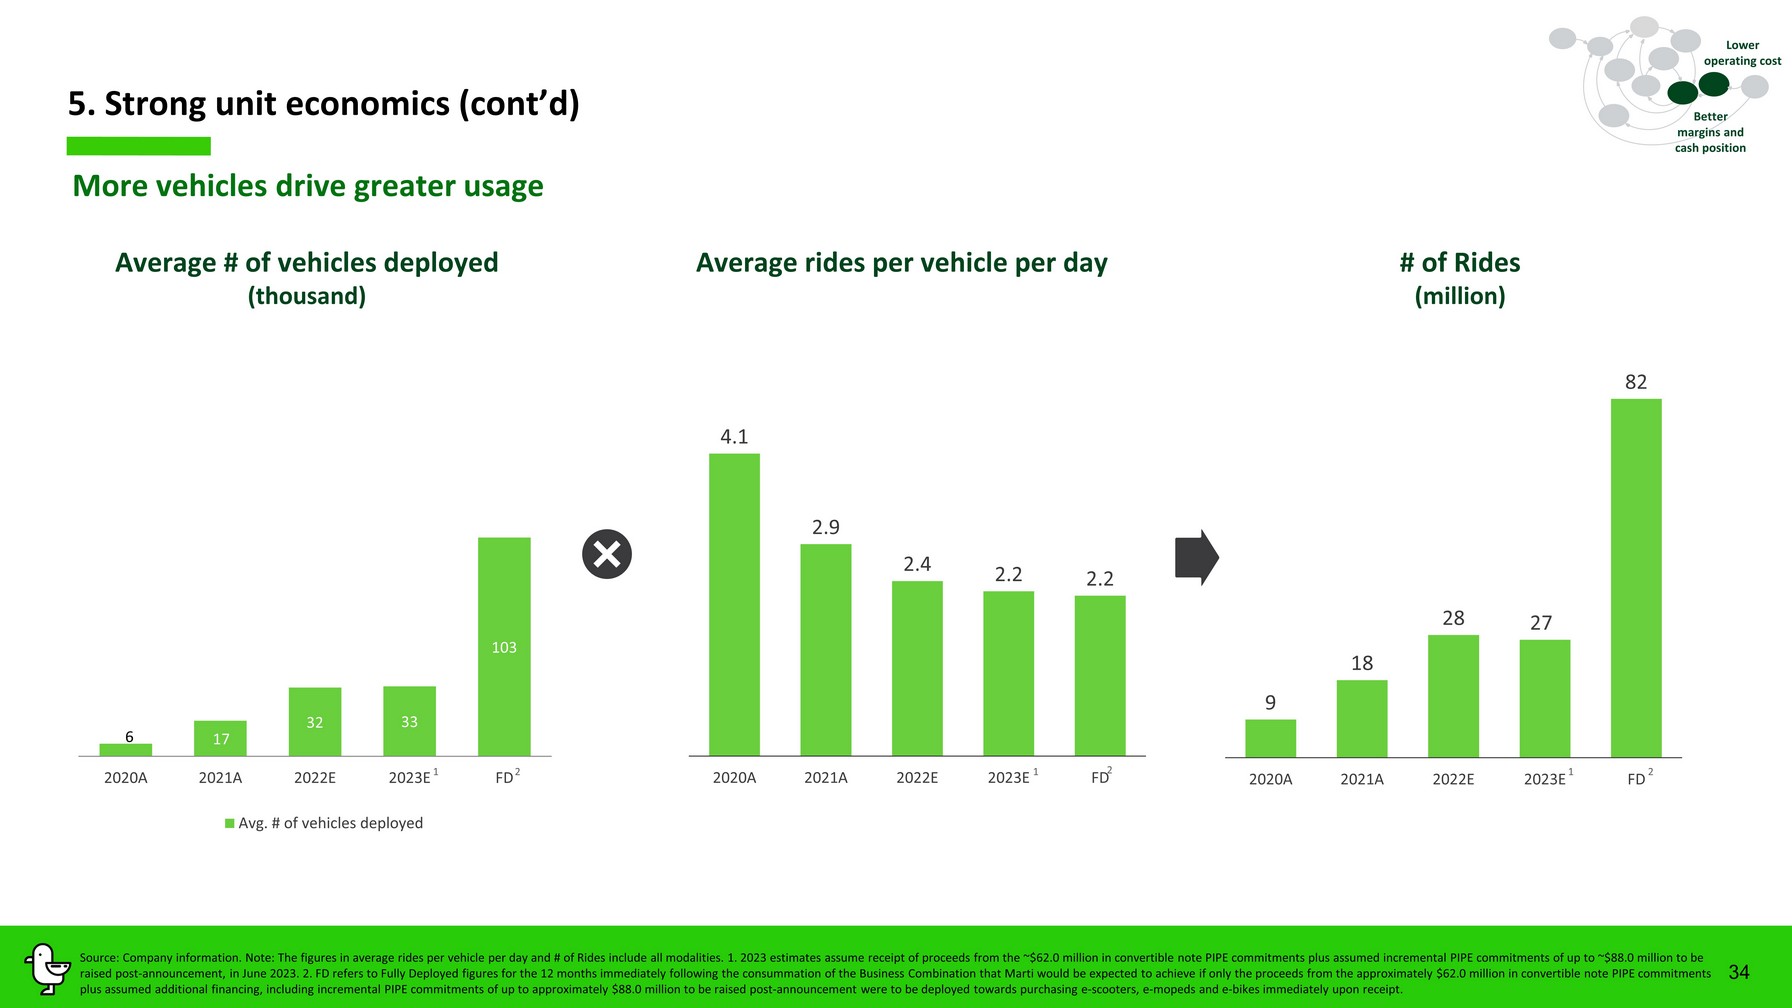
34 5. Strong unit economics (cont’d) Average rides per vehicle per day Average # of vehicles deployed ( thousand ) # of Rides (m ill ion ) M ore vehicles drive greater usage 17 32 33 103 2020A 2021A 2022E 2023E FD Avg. # of vehicles deployed 9 18 28 27 82 2020A 2021A 2022E 2023E FD 4.1 2.9 2.4 2.2 2.2 2020A 2021A 2022E 2023E FD Source: Company information. Note: The figures in average rides per vehicle per day and # of Rides include all modalities. 1. 2023 estimates assume receip t of proceeds from the ~$ 62.0 million in convertible note PIPE commitments plus assumed incremental PIPE commitments of up to ~$ 88.0 million to be raised post - announcement , in June 2023 . 2. FD refers to Fully Deployed figures for the 12 months immediately following the consummation of the Business Combination that Ma rti would be expected to achieve if only the proceeds from the approximately $62.0 million in convertible note PIPE commitmen ts plus assumed additional financing , including incremental PIPE commitments of up to approximately $88.0 million to be raised post - announcement were to be deployed towards pur chasing e - scooters, e - mopeds and e - bikes immediately upon receipt . Lower operating cost Better margins and cash position 2 2 2 1 1 1 6
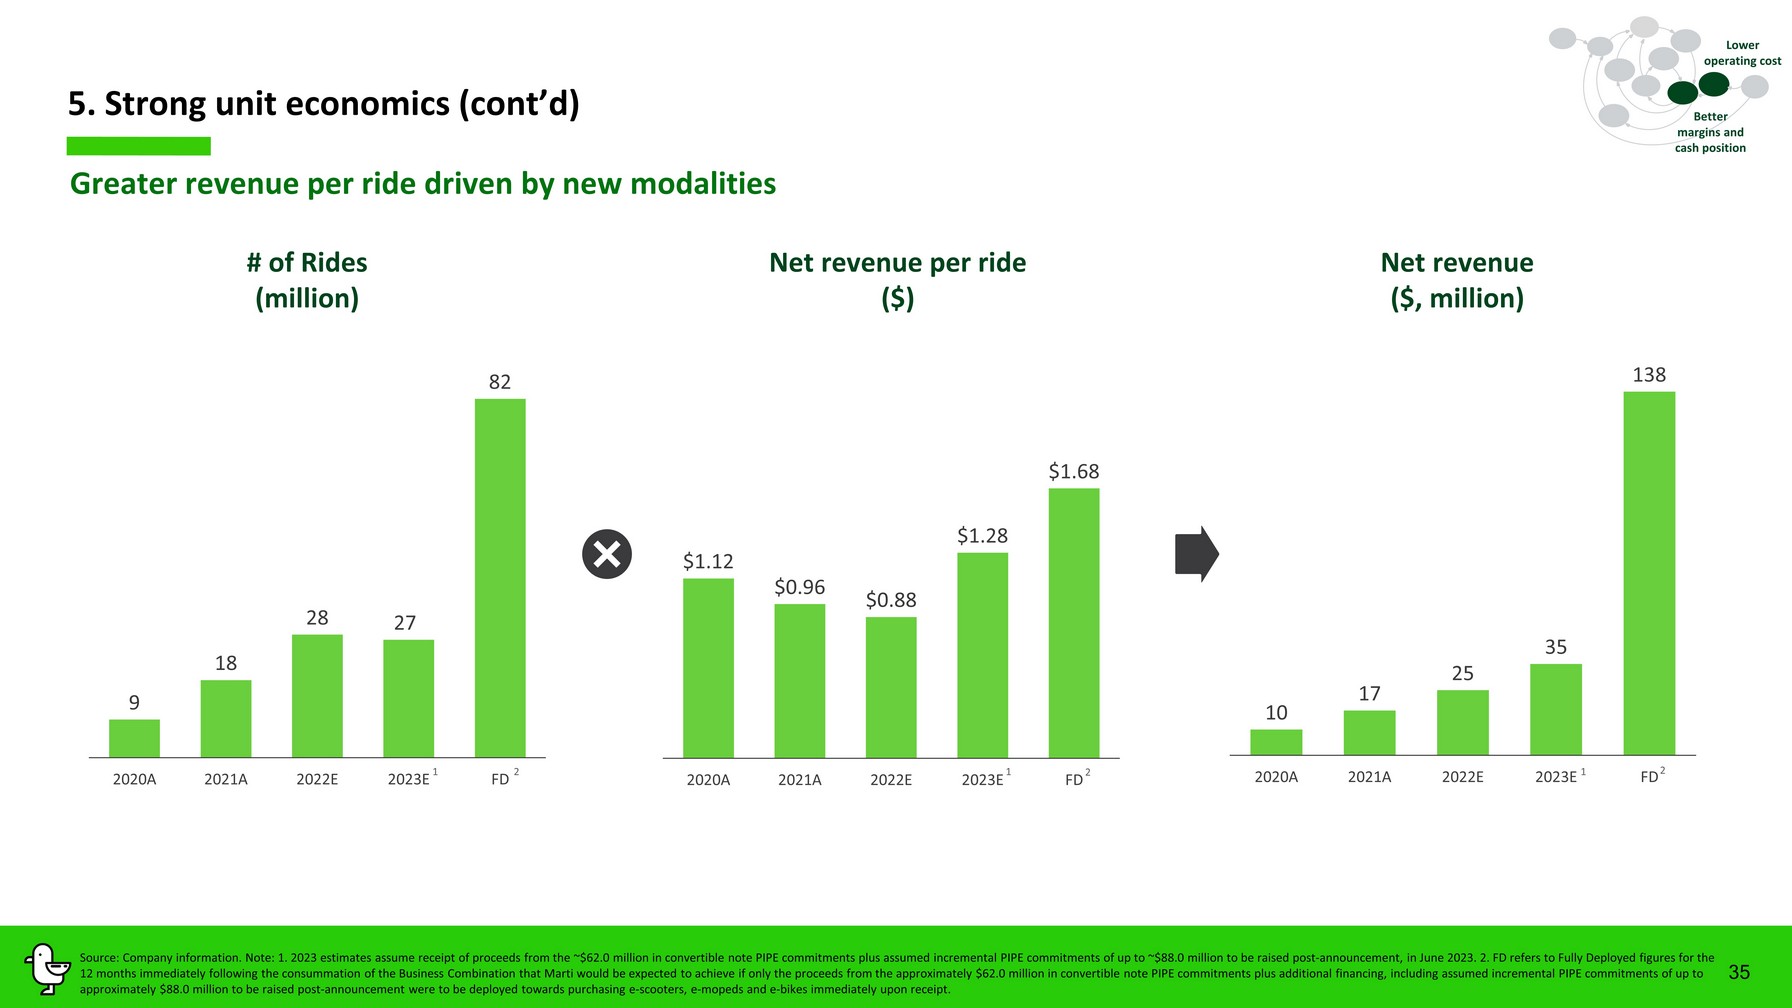
35 10 17 25 35 138 2020A 2021A 2022E 2023E FD Net revenue per ride ($) # of Rides (million) Net revenue ($, million) 5 . Strong unit economics (cont’d) G reater revenue per ride driven by new modalities Lower operating cost Source: Company information. Note: 1. 2023 estimates assume receipt of proceeds from the ~$ 62.0 million in convertible note PIPE commitments plus assumed incremental PIPE commitments of up to ~$ 88.0 million to be raised post - announcement , in June 2023 . 2. FD refers to Fully Deployed figures for the 12 months immediately following the consummation of the Business Combination that Marti would be expected to achieve if only the proceeds from the approximately $62.0 million in convertible note PIPE commitments plus additional financing , including assumed incremental PIPE commitments of up to approximately $88.0 million to be raised post - announcement were to be deployed towards purchasing e - scooters, e - mopeds and e - bik es immediately upon receipt . Better margins and cash position $1.12 $0.96 $0.88 $1.28 $1.68 2020A 2021A 2022E 2023E FD 9 18 28 27 82 2020A 2021A 2022E 2023E FD 2 2 2 1 1 1
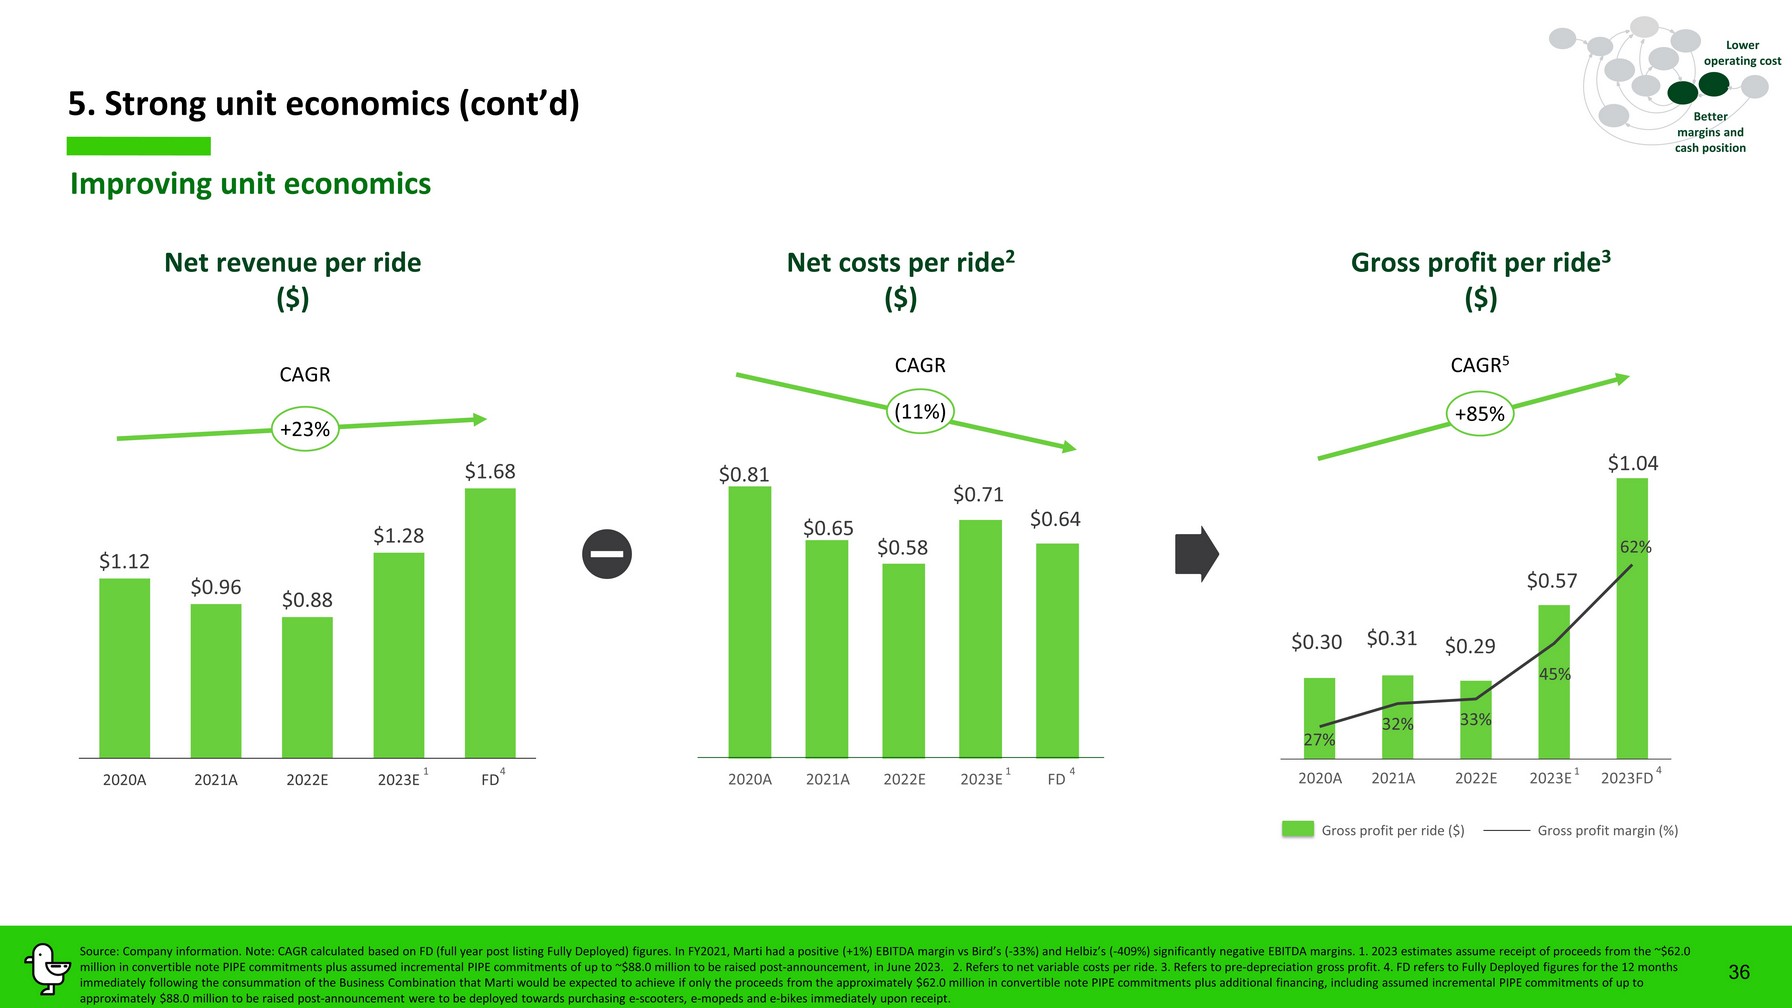
$1.12 $0.96 $0.88 $1.28 $1.68 2020A 2021A 2022E 2023E FD Net costs per ride 2 ($) Net revenue per ride ($) Gross profit per ride 3 ($) 5 . Strong unit economics (cont’d) 36 Improving unit economics Gross profit per ride ($) Gross profit margin (%) + 23 % CAGR 2020A 2021A 2022E 2023E 2023FD $0.30 $0.31 $0.29 $0.57 $1.04 27% 32% 33% 45% 62% $0.81 $0.65 $0.58 $0.71 $0.64 2020A 2021A 2022E 2023E Source: Company information. Note: CAGR calculated based on FD ( full year post listing Fully Deployed) figures. In FY2021, Marti had a positive (+1%) EBITDA margin vs Bird’s ( - 33%) and Helbiz’s ( - 409%) significantly negative EBITDA margins . 1. 2023 estimates assume receipt of proceeds from the ~$ 62.0 million in convertible note PIPE commitments plus assumed incremental PIPE commitments of up to ~$ 88.0 million to be raised post - announcement , in June 2023 . 2. Refers to net variable costs per ride. 3 . Refers to pre - depreciation gross profit. 4 . FD refers to Fully Deployed figures for the 12 months immediately following the consummation of the Business Combination that Marti would be expected to achieve if only the procee ds from the approximately $62.0 million in convertible note PIPE commitments plus additional financing , including assumed incremental PIPE commitments of up to approximately $88.0 million to be raised post - announcement were to be deployed towards purchasing e - scooters, e - mopeds and e - bik es immediately upon receipt . ( 11 % ) CAGR + 85 % CAGR 5 Lower operating cost Better margins and cash position 4 4 4 FD 1 1 1
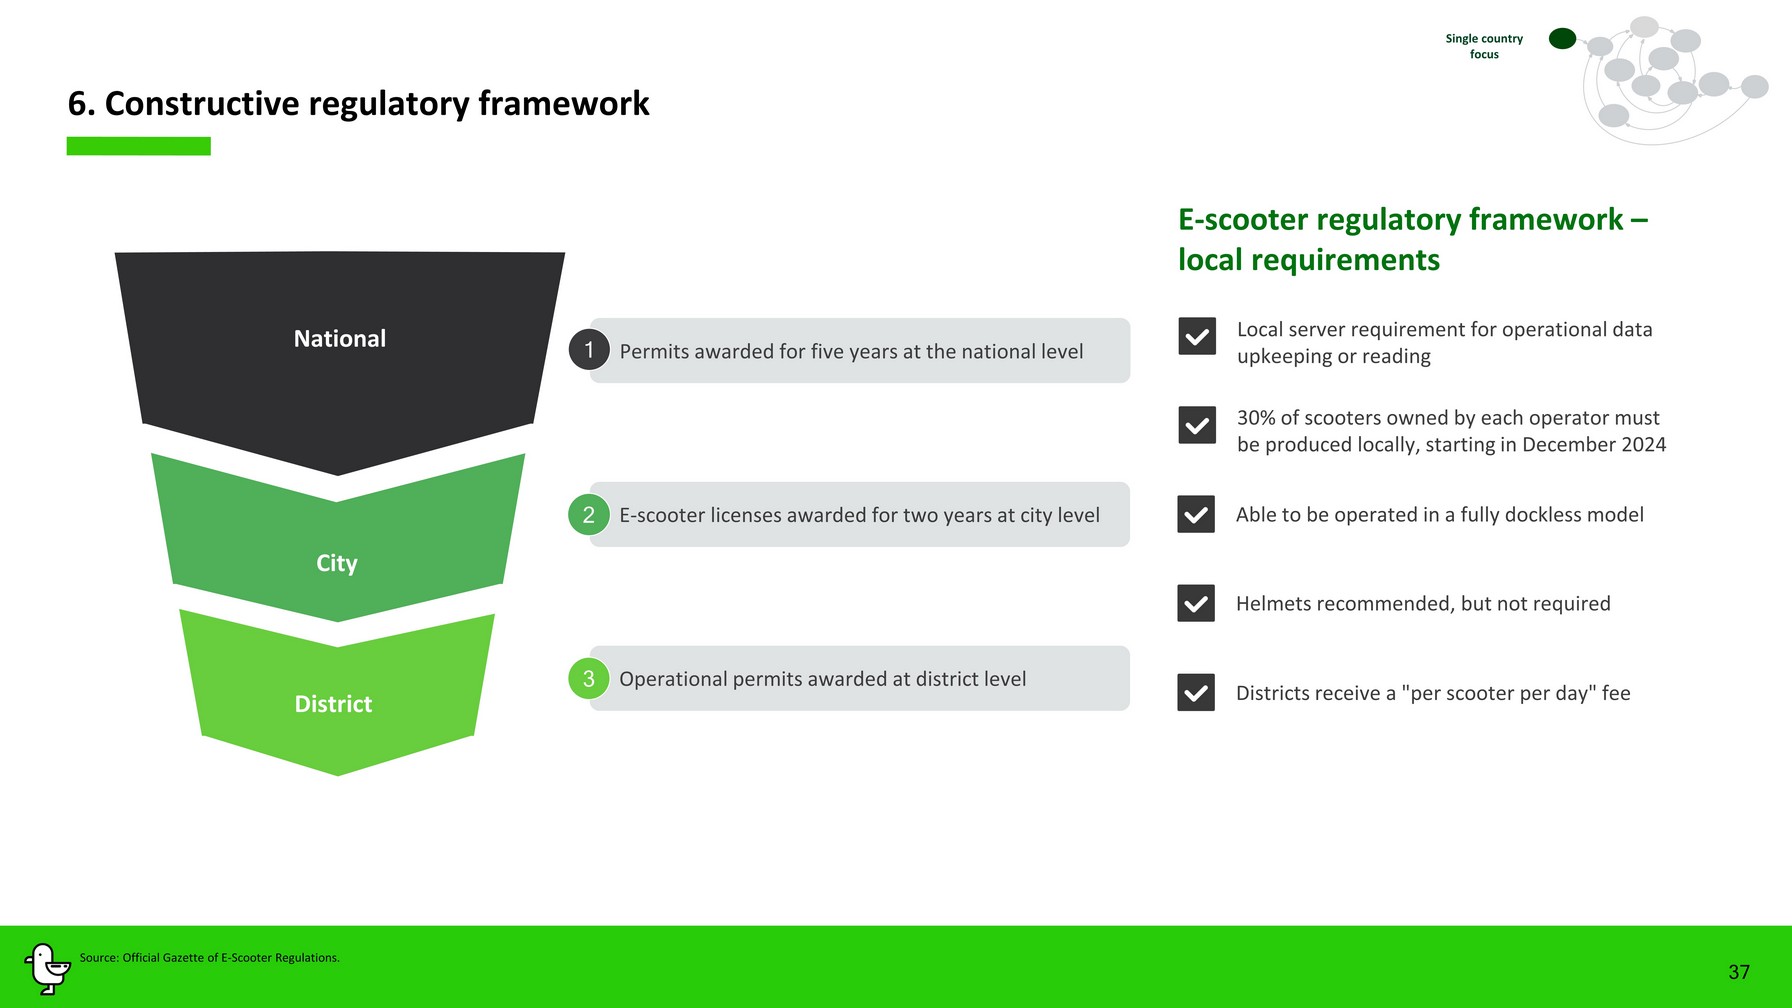
37 6 . Constructive regulatory framework Operational permits awarded at district level E - s cooter regulatory framework – local requirements 30% of scooters owned by each operator must be produced locally , starting in December 2024 Districts receive a "per scooter per day" fee Able to be operated in a fully dockless model Local server requirement for operational data upkeeping or reading Helmets recommended, but not required National City District E - scooter licenses awarded for two years at city level 2 3 Permits awarded for five years at the national level 1 Single country focus Source: Official Gazette of E - Scooter Regulations.
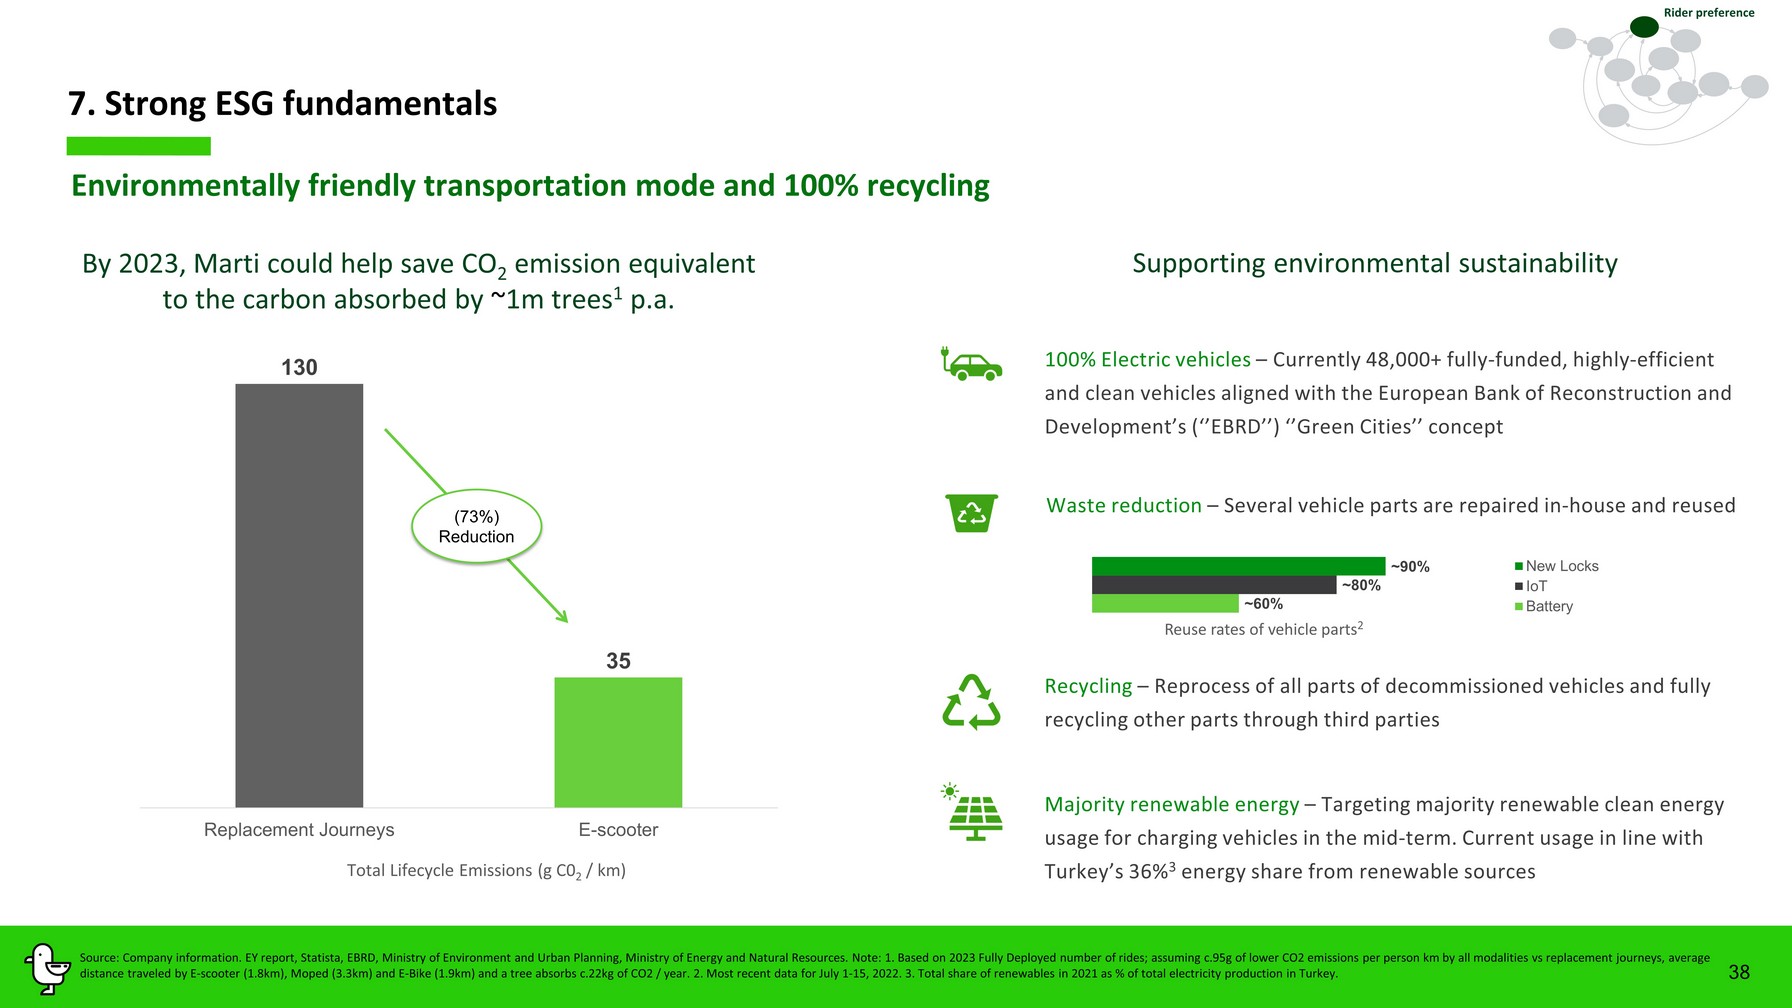
7 . Strong ESG fundamentals 38 Environmentally friendly transportation mode and 100% recycling 130 35 Replacement Journeys E-scooter By 2023, Marti could help save CO 2 emission equivalent to the carbon absorbed by ~ 1m trees 1 p.a. Total Lifecycle Emissions (g C0 2 / km) (73%) Reduction Supporting environmental sustainability Recycling – Reprocess of all parts of decommissioned vehicles and fully recycling other parts through third parties Waste reduction – Several vehicle parts are repaired in - house and reused 100% Electric vehicles – Currently 4 8 ,000 + fully - funded , highly - efficient and clean vehicles aligned with the European Bank of Reconstruction and Development’s (‘’EBRD’’) ‘’ Green Cities ’’ concept Majority renewable energy – Targeting majority renewable clean energy usage for charging vehicles in the mid - term. Current usage in line with Turkey’s 36 % 3 energy share from renewable sources ~60% ~80% ~90% New Locks IoT Battery Reuse rates of vehicle parts 2 Source: Company information. EY report, Statista, EBRD, Ministry of Environment and Urban Planning, Ministry of Energy and Na tur al Resources. Note: 1. Based on 2023 Fully Deployed number of rides; assuming c.95g of lower CO2 emissions per person km by a ll modalities vs replacement journeys, average distance traveled by E - scooter (1.8km), Moped (3.3km) and E - Bike (1.9km) and a tree absorbs c.22kg of CO2 / year. 2. Most recent data for July 1 - 15, 2022. 3. Total share of renewables in 202 1 as % of total electricity production in Turkey. Rider preference
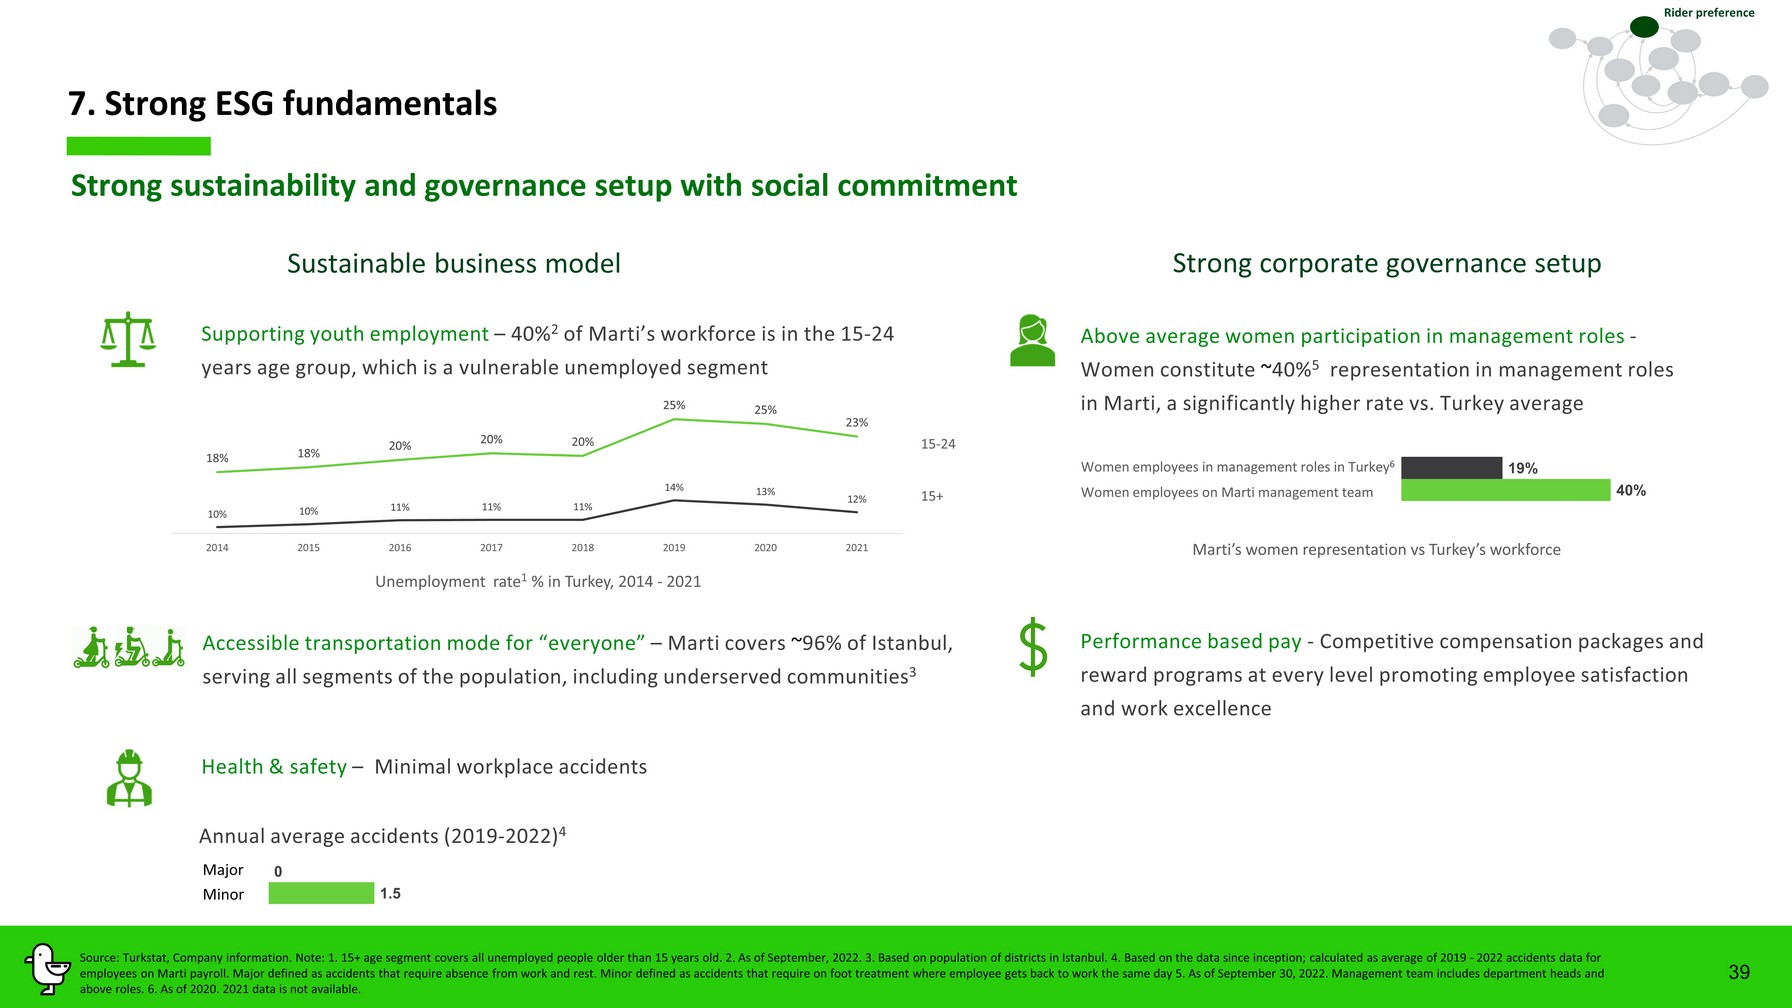
Major 7 . Strong ESG fundamentals 39 Strong sustainability and governance setup with social commitment S ustainable business model Strong corporate governance setup Supporting youth employment – 40 % 2 of Marti ’s workforce is in the 15 - 24 years age group, which is a vulnerable unemployed segment Accessible transportation mode for “everyone” – Marti covers ~ 96% of Istanbul, serving all segments of the population, including underserved communities 3 Performance based pay - Competitive compensation packages and reward programs at every level promoting employee satisfaction and work excellence 40% 19% Above average women participation in management roles - Women constitute ~ 40 % 5 representation in management roles in Marti, a significantly higher rate vs. Turkey average Health & safety – Minimal workplace accidents Unemployment rate 1 % in Turkey, 2014 - 2021 Marti’s women representation vs Turkey’s workforce 1.5 0 Minor Annual average accidents (2019 - 2022) 4 15+ 15 - 24 Women employees in management roles in Turkey 6 Women employees on Marti management team Source: Turkstat , Company information. Note: 1. 15+ age segment covers all unemployed people older than 15 years old. 2. As of September , 2022. 3 . Based on population of districts in Istanbul. 4 . Based on the data since inception; calculated as average of 2019 - 2022 accidents data for employees on Marti payroll. Major defined as accidents that require absence from work and rest. Minor defined as accidents th at require on foot treatment where employee gets back to work the same day 5 . As of September 30 , 2022. Management team includes department heads and above roles . 6. As of 2020. 2021 data is not available . Rider preference 18% 18% 20% 20% 20% 25% 25% 23% 10% 10% 11% 11% 11% 14% 13% 12% 2014 2015 2016 2017 2018 2019 2020 2021
Financials
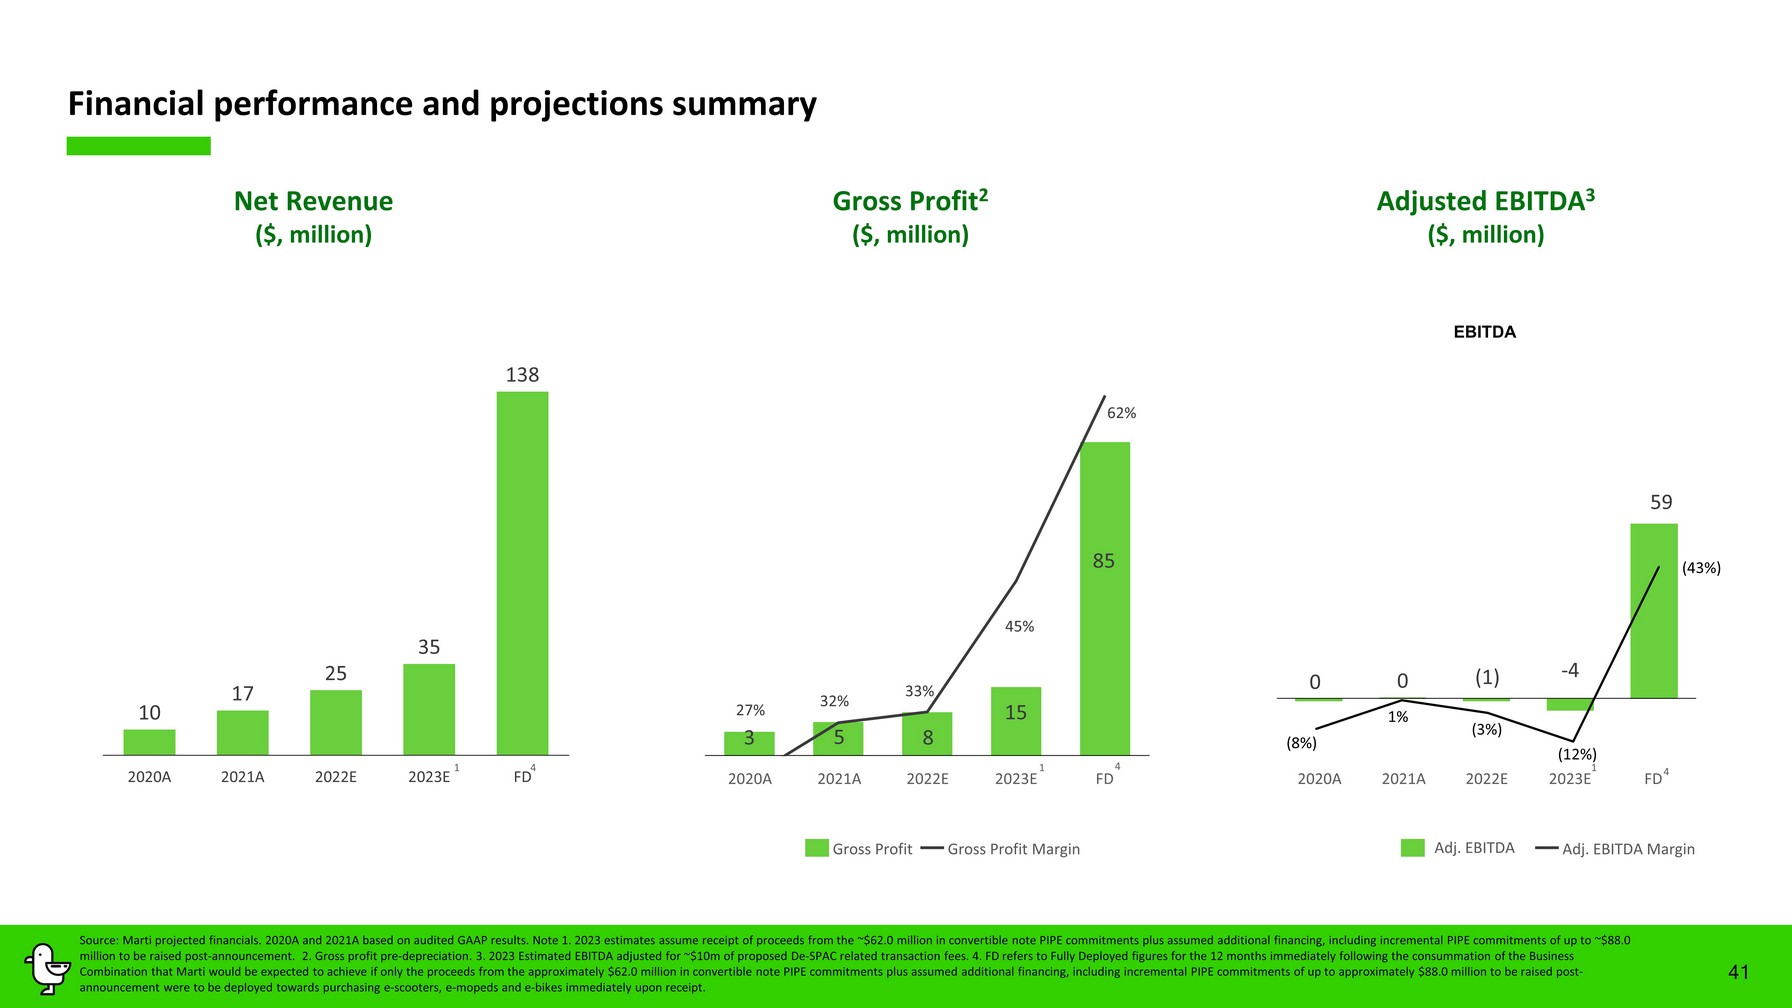
41 Adjusted EBITDA 3 ($, million) Gross Profit 2 ($, million) Financial performance and projections summary Net Revenue ( $, million) 0 0 (1) - 4 59 -15 35 85 EBITDA Adj . EBITDA Adj . EBITDA Margin 3 5 8 15 85 27% 32% 33% 45% 62% 29% 34% 39% 44% 49% 54% 59% 64% -4 46 96 Gross Profit Gross Profit Margin Source: Marti projected financials. 2020A and 2021A based on audited GAAP results . Note 1. 2023 estimates assume receipt of proceeds from the ~$ 62.0 million in convertible note PIPE commitments plus assumed additional financing , including incremental PIPE commitments of up to ~$ 88.0 million to be raised post - announcement. 2. Gross profit pre - depreciation. 3. 202 3 Estimated EBITDA adjusted for ~$1 0 m of proposed De - SPAC related transaction fees. 4 . FD refers to Fully Deployed figures for the 12 months immediately following the consummation of the Business Combination that Marti would be expected to achieve if only the proceeds from the approximately $62.0 million in convertible not e PIPE commitments plus assumed additional financing , including incremental PIPE commitments of up to approximately $88.0 million to be raised post - announcement were to be deployed towards purchasing e - scooters, e - mopeds and e - bikes immediately upon receipt . 10 17 25 35 138 2020A 2021A 2022E 2023E FD 2020A 2021A 2022E 2023E FD 2020A 2021A 2022E 2023E FD 4 4 4 1 1 1 (8%) 1% (3%) (12%) (43%)
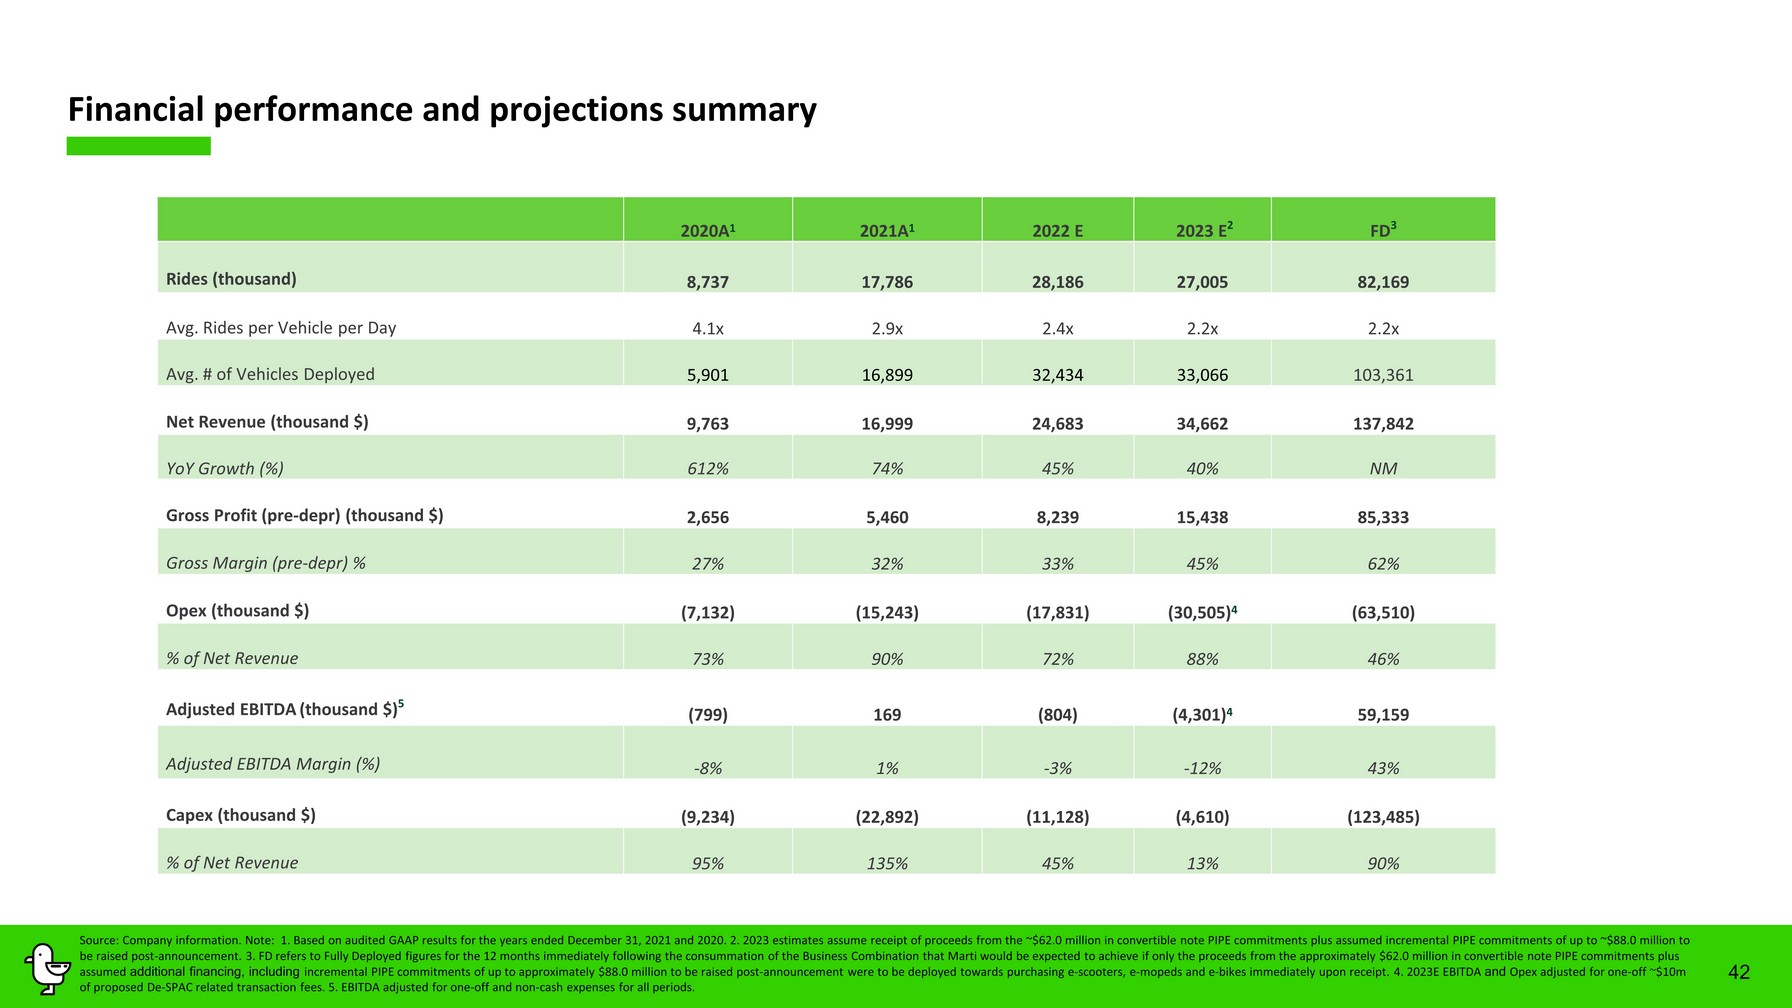
42 Financial performance and projections summary Source: Company information. Note: 1. Based on audited GAAP results for the years ended December 31, 2021 and 2020. 2 . 2023 estimates assume receipt of proceeds from the ~$ 62.0 million in convertible note PIPE commitments plus assumed incremental PIPE commitments of up to ~$ 88.0 million to be raised post - announcement. 3 . FD refers to Fully Deployed figures for the 12 months immediately following the consummation of the Business Combination that Ma rti would be expected to achieve if only the proceeds from the approximately $62.0 million in convertible note PIPE commitmen ts plus assumed additional financing , including incremental PIPE commitments of up to approximately $88.0 million to be raised post - announcement were to be deployed towards pur chasing e - scooters, e - mopeds and e - bikes immediately upon receipt . 4. 202 3 E EBITDA and Opex adjusted for one - off ~ $ 10 m of proposed De - SPAC related transaction fees. 5 . EBITDA adjusted for one - off and non - cash expenses for all periods . 2020A 1 2021A 1 2022 E 2023 E 2 FD 3 Rides (thousand) 8,737 17,786 28,186 27,005 82,169 Avg. Rides per Vehicle per Day 4.1x 2.9x 2 . 4x 2.2x 2 . 2x Avg. # of Vehicles Deployed 5,901 16,899 32,434 33,066 103,361 Net Revenue (thousand $) 9,763 16,999 24,683 34,66 2 137,842 YoY Growth (%) 612% 74% 45% 40 % NM Gross Profit (pre - depr ) (thousand $) 2,656 5,460 8,239 15,438 85,333 Gross Margin (pre - depr ) % 27 % 3 2 % 33% 4 5% 62% Opex (thousand $) (7,132) (15,243) (17,831) (30,505) 4 (63,510) % of Net Revenue 73 % 90 % 72 % 88 % 46 % Adjusted EBITDA (thousand $) 5 (799) 169 ( 804 ) (4,301) 4 59,159 Adjusted EBITDA Margin (%) - 8% 1% - 3% - 1 2 % 4 3 % Capex (thousand $) ( 9,234 ) ( 2 2 ,892 ) ( 11,128 ) ( 4,610 ) ( 123,485 ) % of Net Revenue 95% 1 35 % 45% 13% 90%
Transaction Summary
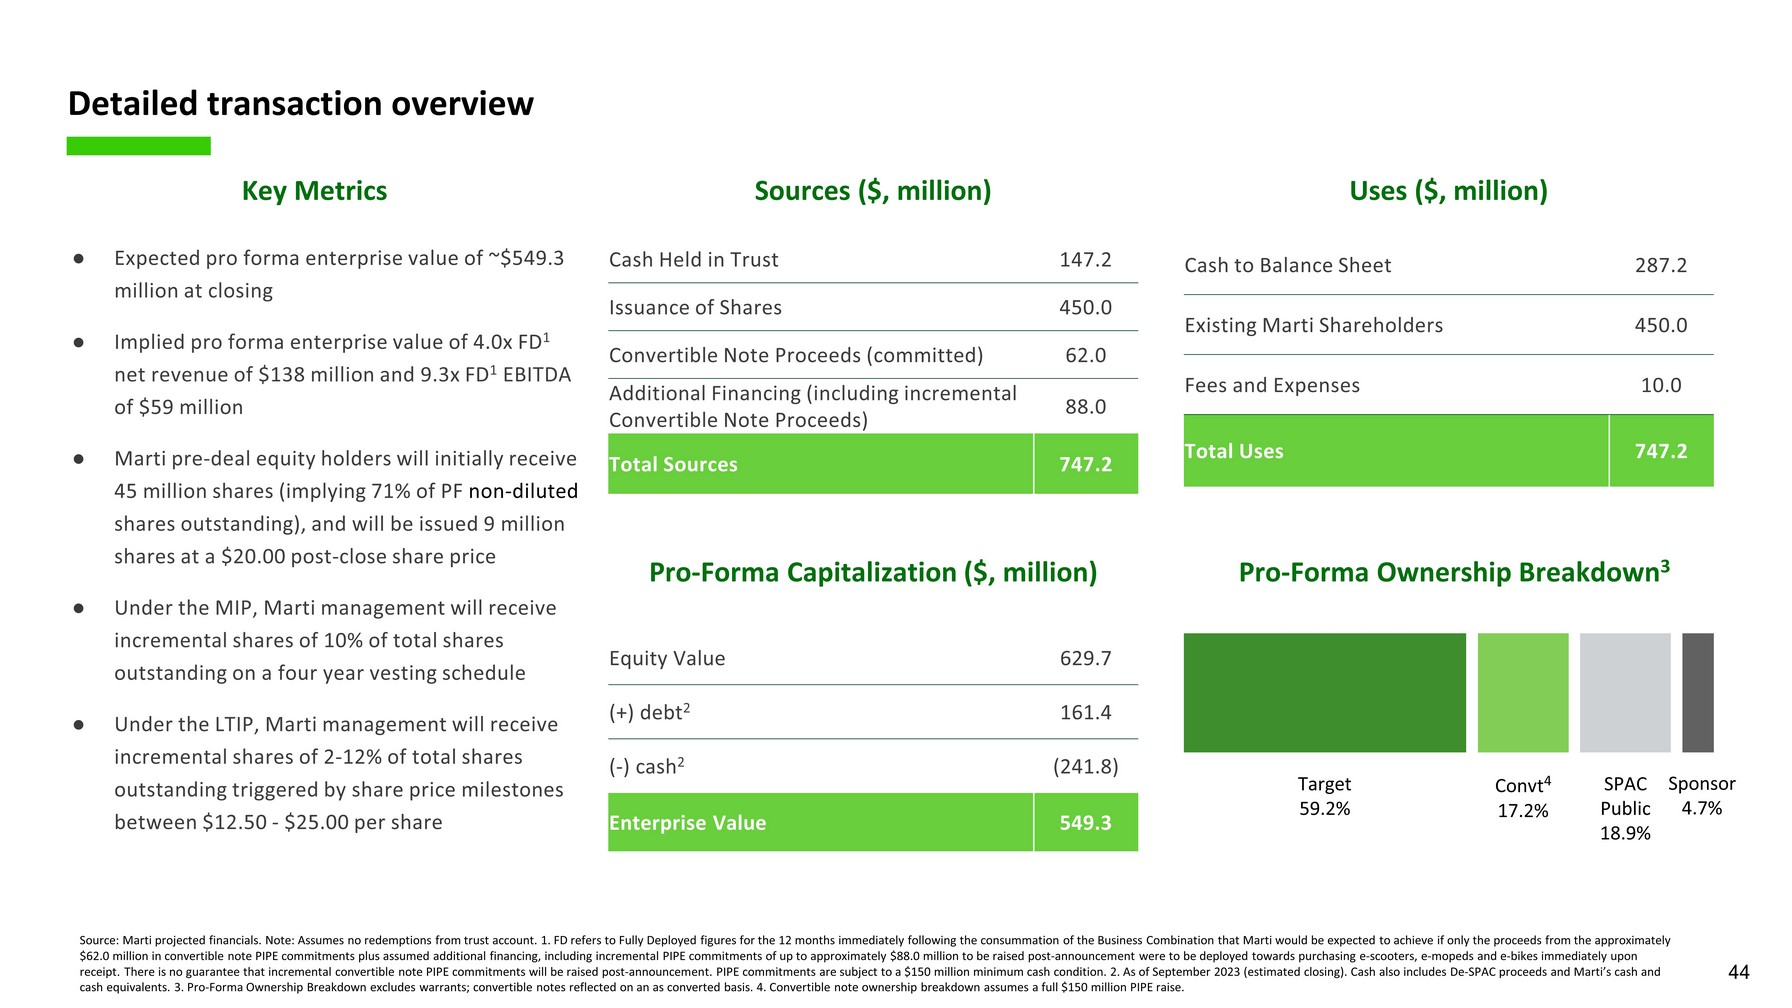
Detailed transaction overview Sources ($, million) Uses ($, million) 44 Pro-Forma Ownership Breakdown3 Key Metrics ● Expected pro forma enterprise value of ~$549.3 million at closing ● Implied pro forma enterprise value of 4.0x FD1 net revenue of $138 million and 9.3x FD1 EBITDA of $59 million ● Marti pre-deal equity holders will initially receive 45 million shares (implying 71% of PF non-diluted shares outstanding), and will be issued 9 million shares at a $20.00 post-close share price ● Under the MIP, Marti management will receive incremental shares of 10% of total shares outstanding on a four year vesting schedule ● Under the LTIP, Marti management will receive incremental shares of 2-12% of total shares outstanding triggered by share price milestones between $12.50 - $25.00 per share Cash to Balance Sheet 287.2 Existing Marti Shareholders 450.0 Fees and Expenses 10.0 Total Uses 747.2 Cash Held in Trust 147.2 Issuance of Shares 450.0 Convertible Note Proceeds (committed) 62.0 Additional Financing (including incremental Convertible Note Proceeds) 88.0 Total Sources 747.2 Target 59.2% Sponsor 4.7% Convt4 17.2% SPAC Public 18.9% Pro-Forma Capitalization ($, million) Equity Value 629.7 (+) debt2 161.4 (-) cash2 (241.8) Enterprise Value 549.3 Source: Marti projected financials. Note: Assumes no redemptions from trust account. 1. FD refers to Fully Deployed figures for the 12 months immediately following the consummation of the Business Combination that Marti would be expected to achieve if only the proceeds from the approximately $62.0 million in convertible note PIPE commitments plus assumed additional financing, including incremental PIPE commitments of up to approximately $88.0 million to be raised post-announcement were to be deployed towards purchasing e-scooters, e-mopeds and e-bikes immediately upon receipt. There is no guarantee that incremental convertible note PIPE commitments will be raised post-announcement. PIPE commitments are subject to a $150 million minimum cash condition. 2. As of September 2023 (estimated closing). Cash also includes De-SPAC proceeds and Marti’s cash and cash equivalents. 3. Pro-Forma Ownership Breakdown excludes warrants; convertible notes reflected on an as converted basis. 4. Convertible note ownership breakdown assumes a full $150 million PIPE raise.
Appendix
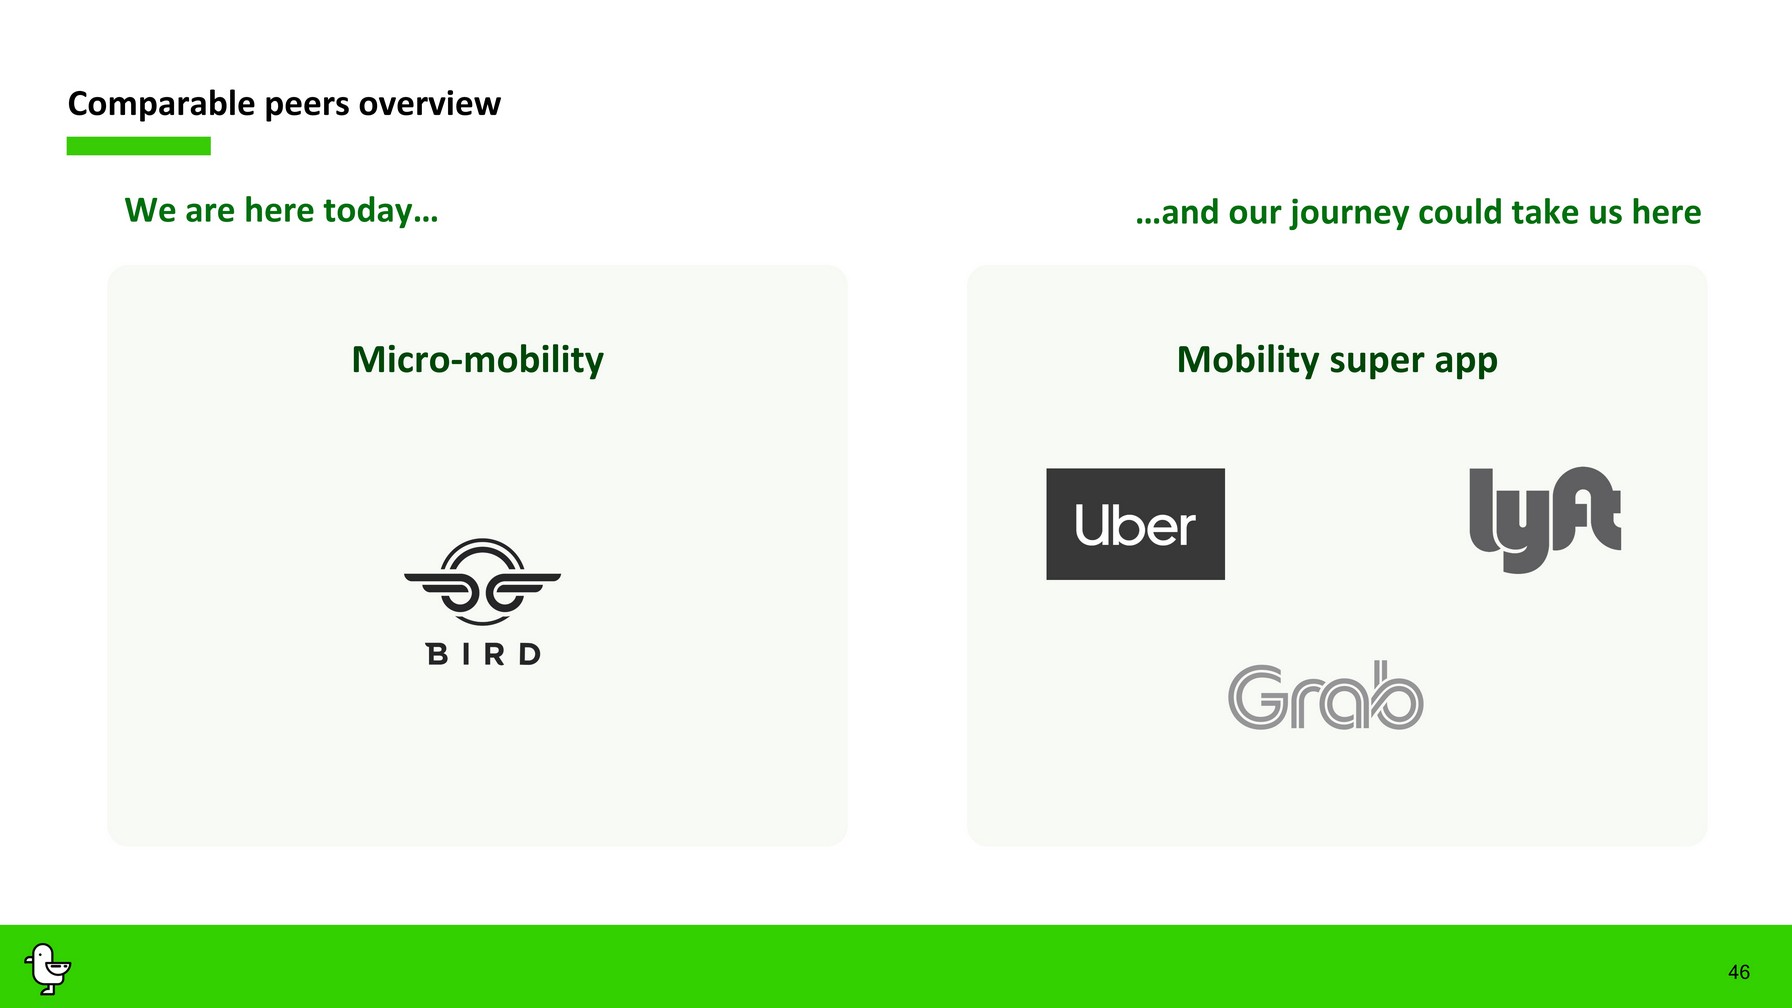
Comparable peers overview 46 Micro - mobility …and our journey could take us here Mobility super app We are here today…
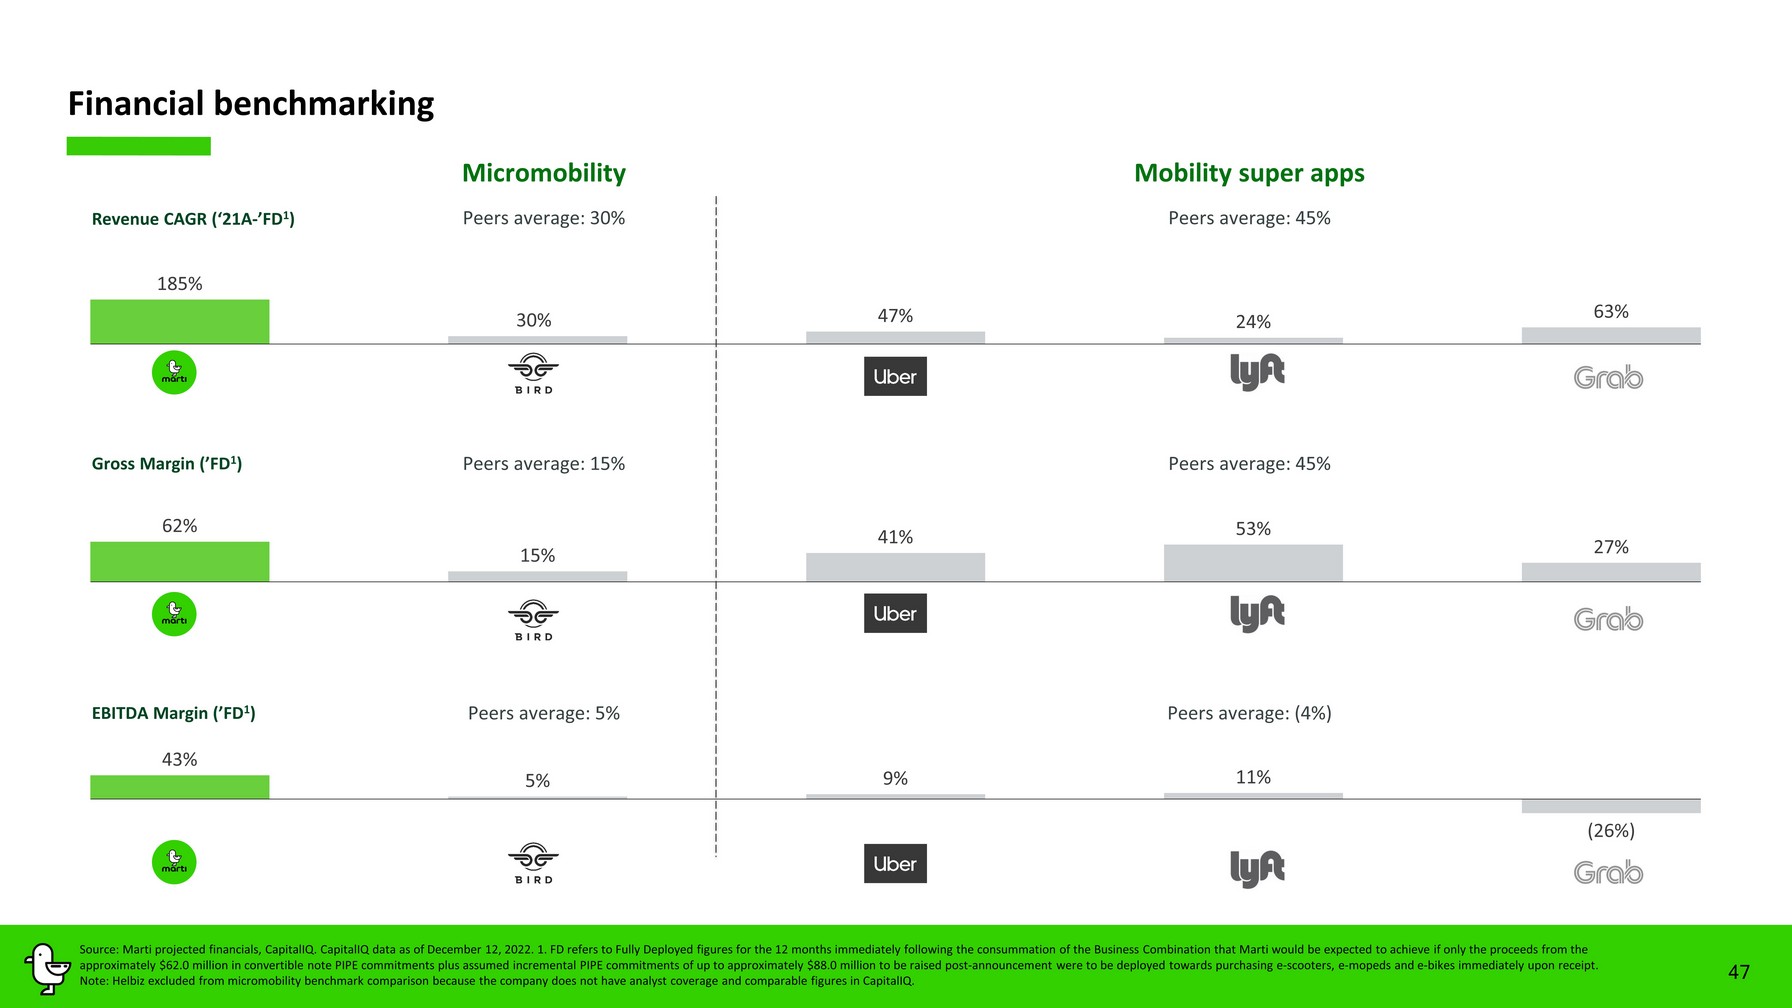
62% 15% 41% 53% 27% 185% 30% 47% 24% 63% Financial benchmarking Micromobility 47 Mobility super apps Revenue CAGR (‘21A - ’ FD 1 ) Gross Margin ( ’ FD 1 ) Peers average: 15 % Peers average: 30 % Source: Marti projected financials, CapitalIQ . CapitalIQ data as of December 12 , 2022. 1. FD refers to Fully Deployed figures for the 12 months immediately following the consummation of the Business Combination that Ma rti would be expected to achieve if only the proceeds from the approximately $62.0 million in convertible note PIPE commitments plus assumed incremental PIPE commitments of up to approxima tel y $88.0 million to be raised post - announcement were to be deployed towards purchasing e - scooters, e - mopeds and e - bikes immediate ly upon receipt . Note: Helbiz excluded from micromobility benchmark comparison because the company does not have analyst coverage and comparable figures in CapitalIQ . 43% 5% 9% 11% (26%) Peers average: 45 % Peers average: 45 % EBITDA Margin ( ’ FD 1 ) Peers average: 5 % Peers average: (4 % )
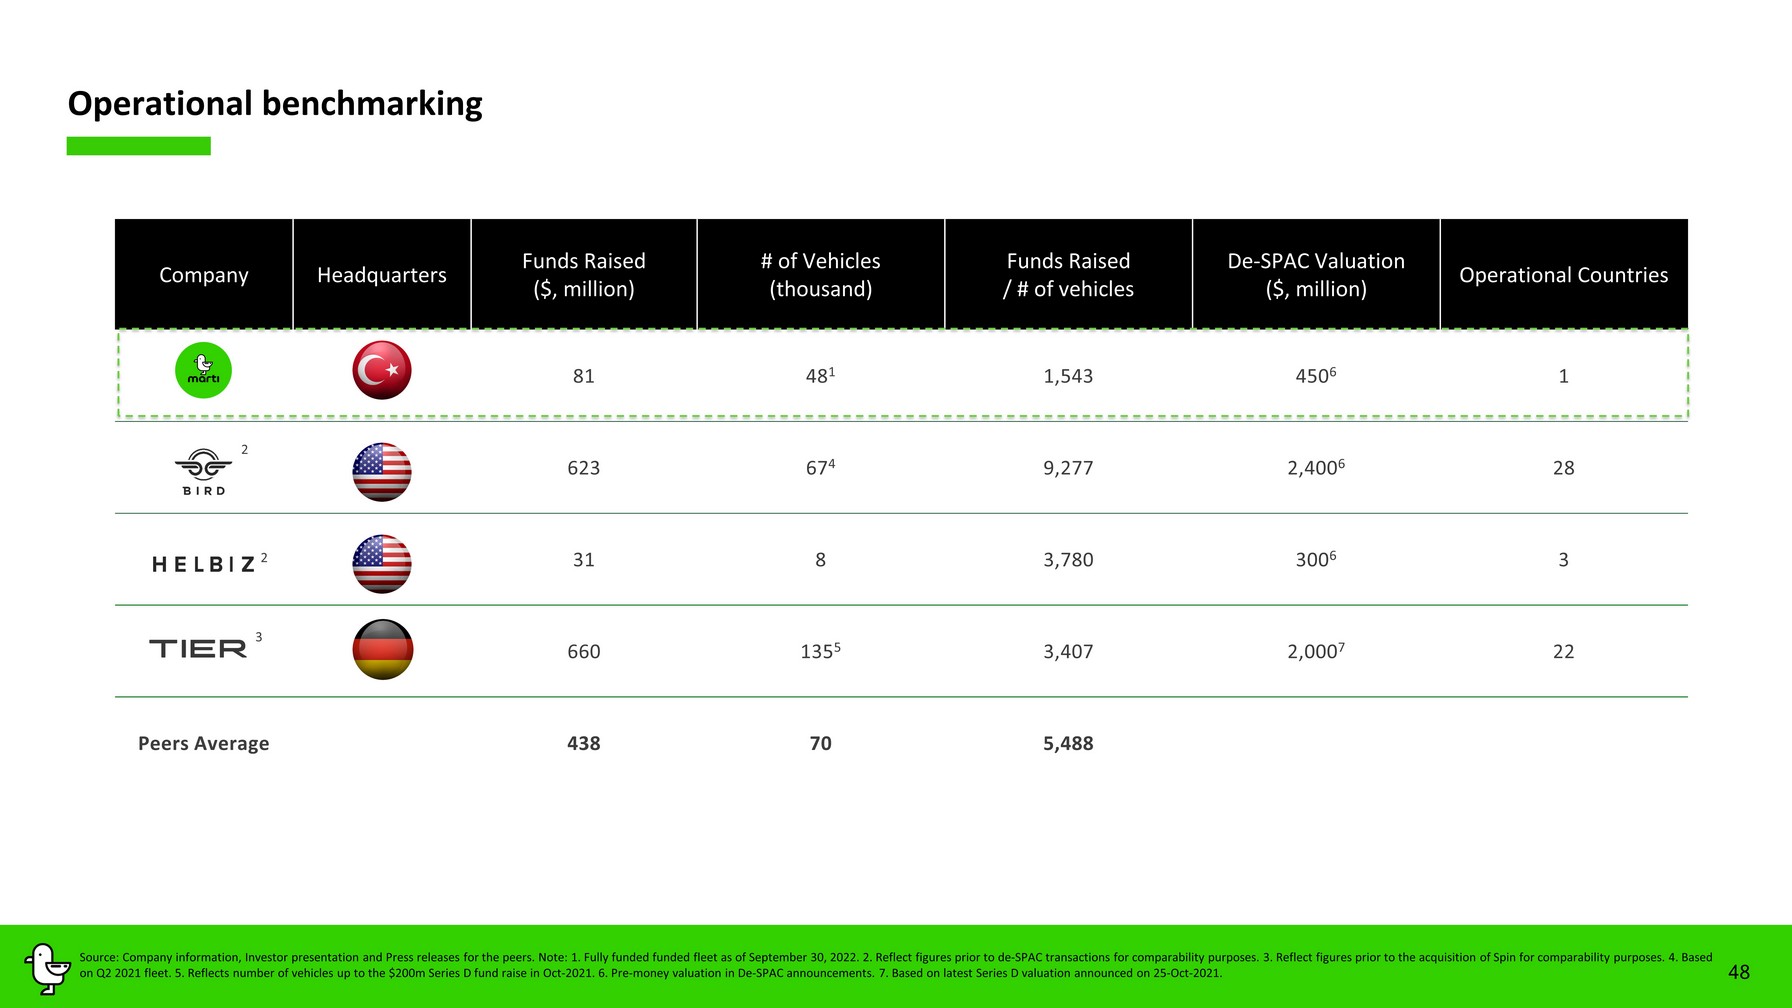
48 Operational benchmarking Company Headquarters Funds Raised ($ , million ) # of Vehicles ( thousand ) Funds Raised / # of vehicles De - SPAC Valuation ($ , million ) Operational Countries 81 4 8 1 1, 543 450 6 1 623 67 4 9,2 77 2,400 6 28 31 8 3,780 300 6 3 660 135 5 3,407 2,000 7 22 Peers Average 438 70 5,488 Source: Company information, Investor presentation and Press releases for the peers. Note: 1 . Fully funded funded fleet as of September 30, 2022 . 2 . Reflect figures prior to de - SPAC transactions for comparability purposes. 3 . Reflect figures prior to the acquisition of Spin for comparability purposes. 4 . Based on Q2 2021 fleet. 5 . Reflects number of vehicles up to the $200m Series D fund raise in Oct - 2021. 6 . Pre - money valuation in De - SPAC announcements. 7 . Based on latest Series D valuation announced on 25 - Oct - 2021. 2 2 3
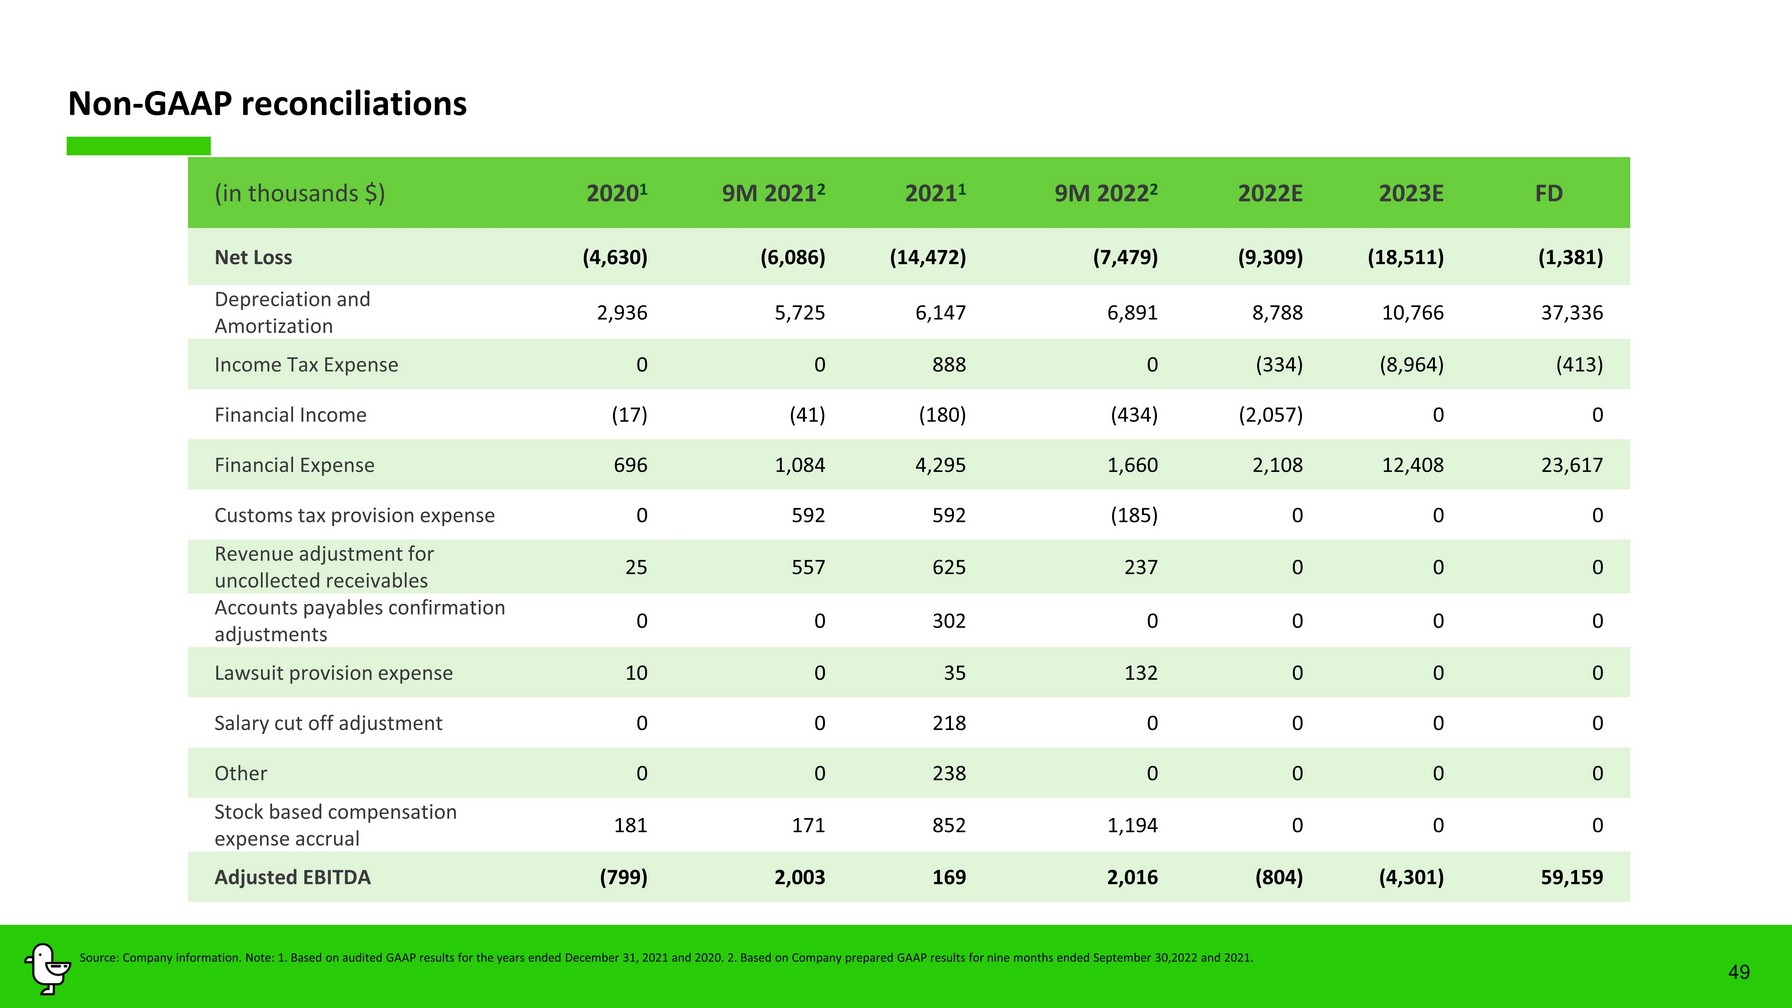
49 Non - GAAP reconciliations (in thousands $) 2020 1 9M 2021 2 2021 1 9M 2022 2 2022E 2023E FD Net Loss (4,630) (6,086) (14,472) (7,479) (9,309) (18,511) (1,381) Depreciation and Amortization 2,936 5,725 6,147 6,891 8,788 10,766 37,336 Income Tax Expense 0 0 888 0 (334) (8,964) (413) Financial Income (17) (41) (180) (434) (2,057) 0 0 Financial Expense 696 1,084 4,295 1,660 2,108 12,408 23,617 Customs tax provision expense 0 592 592 (185) 0 0 0 Revenue adjustment for uncollected receivables 25 557 625 237 0 0 0 Accounts payables confirmation adjustments 0 0 302 0 0 0 0 Lawsuit provision expense 10 0 35 132 0 0 0 Salary cut off adjustment 0 0 218 0 0 0 0 Other 0 0 238 0 0 0 0 Stock based compensation expense accrual 181 171 852 1,194 0 0 0 Adjusted E BITDA ( 799 ) 2,003 169 2,016 (804) (4,301) 59,159 Source: Company information. Note: 1. Based on audited GAAP results for the years ended December 31, 2021 and 2020. 2. Based on Company prepared GAAP results for nine months ended September 30,2022 and 2021.
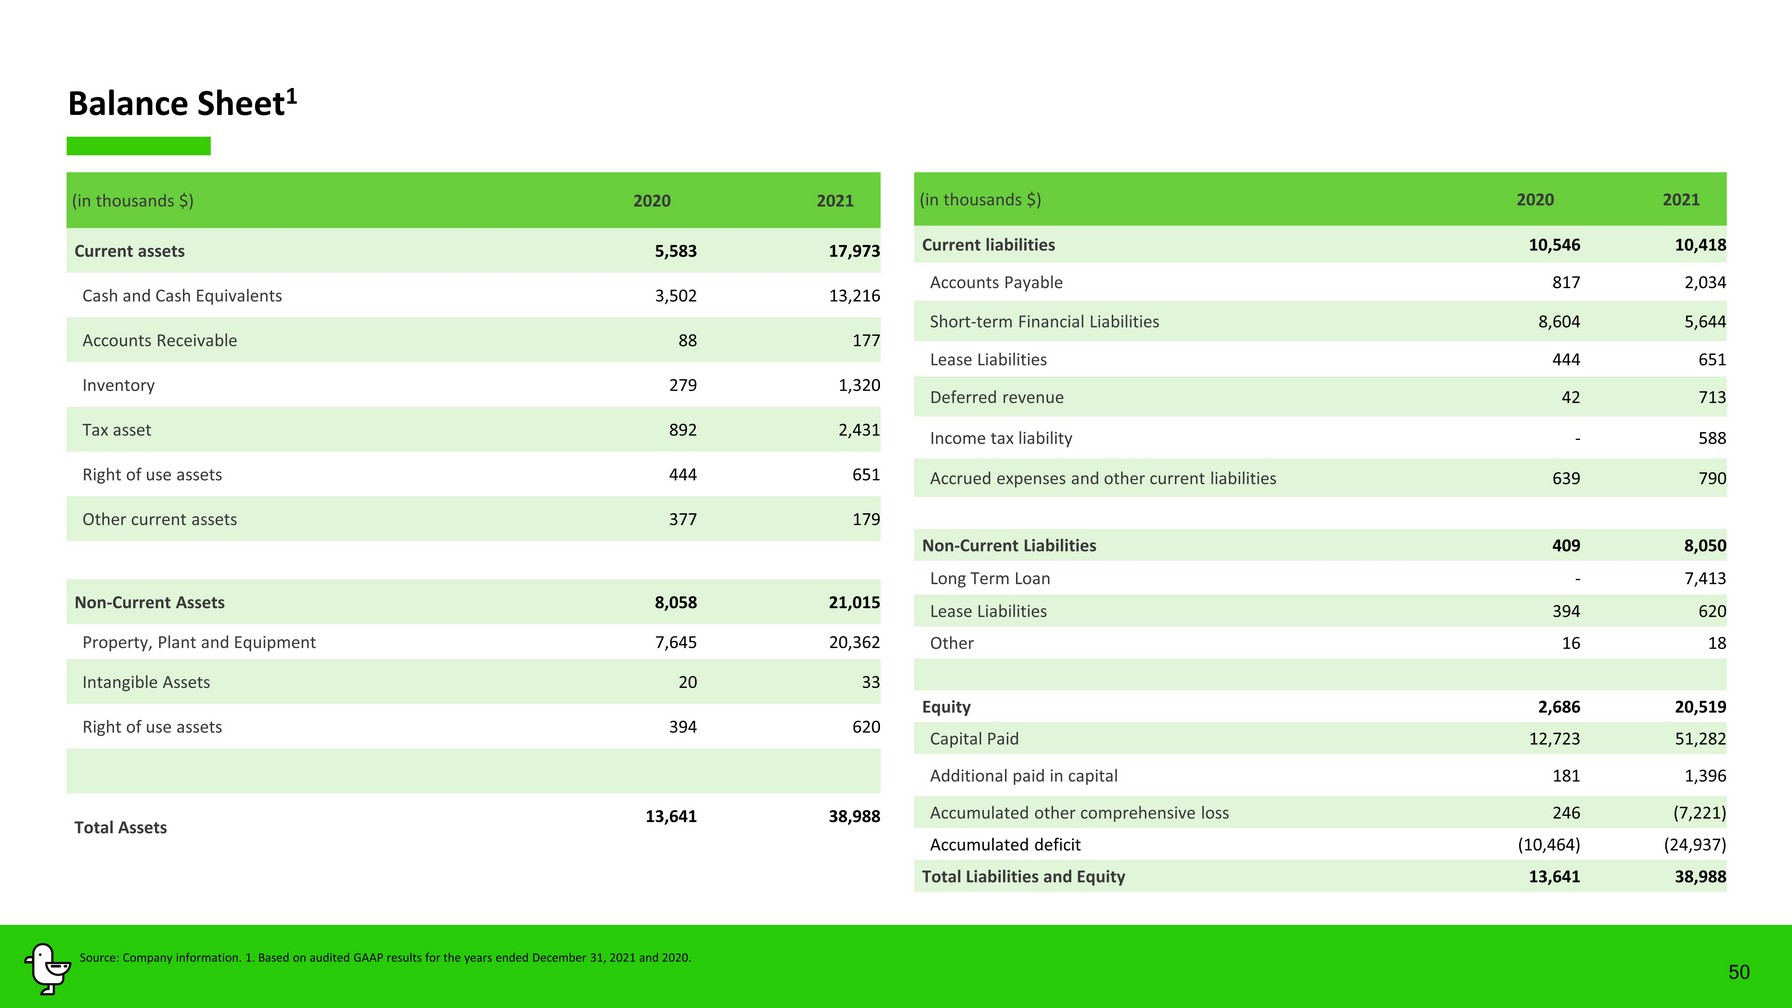
50 Balance Sheet 1 (in thousands $) 2020 2021 Current liabilities 10,546 10,418 Accounts Payable 817 2,034 Short - term Financial Liabilities 8,6 04 5 ,644 Lease Liabilities 444 651 Deferred revenue 42 713 Income tax liability - 588 Accrued expenses and other c urrent liabilities 639 790 Non - Current Liabilities 409 8,050 Long Term Loan - 7,413 Lease Liabilities 394 620 Other 16 18 Equity 2,686 20,519 Capital Paid 12,723 51,282 Additional paid in capital 181 1,396 Accumulated other comprehensive loss 246 (7,221) Accumulated deficit ( 10,464 ) (2 4,937 ) Total Liabilities and Equity 13 ,641 38,988 Source: Company information. 1. Based on audited GAAP results for the years ended December 31, 2021 and 2020. (in thousands $) 2020 2021 Current assets 5,583 17,973 Cash and Cash Equivalents 3,50 2 13, 216 Accounts Receivable 88 177 Inventory 279 1,320 Tax asset 892 2,431 Right of use assets 444 651 Other current assets 377 179 Non - Current Assets 8,058 21,015 Property, Plant and Equipment 7,645 20,362 Intangible Assets 20 33 Right of use assets 3 94 620 Total Assets 13,641 38,988
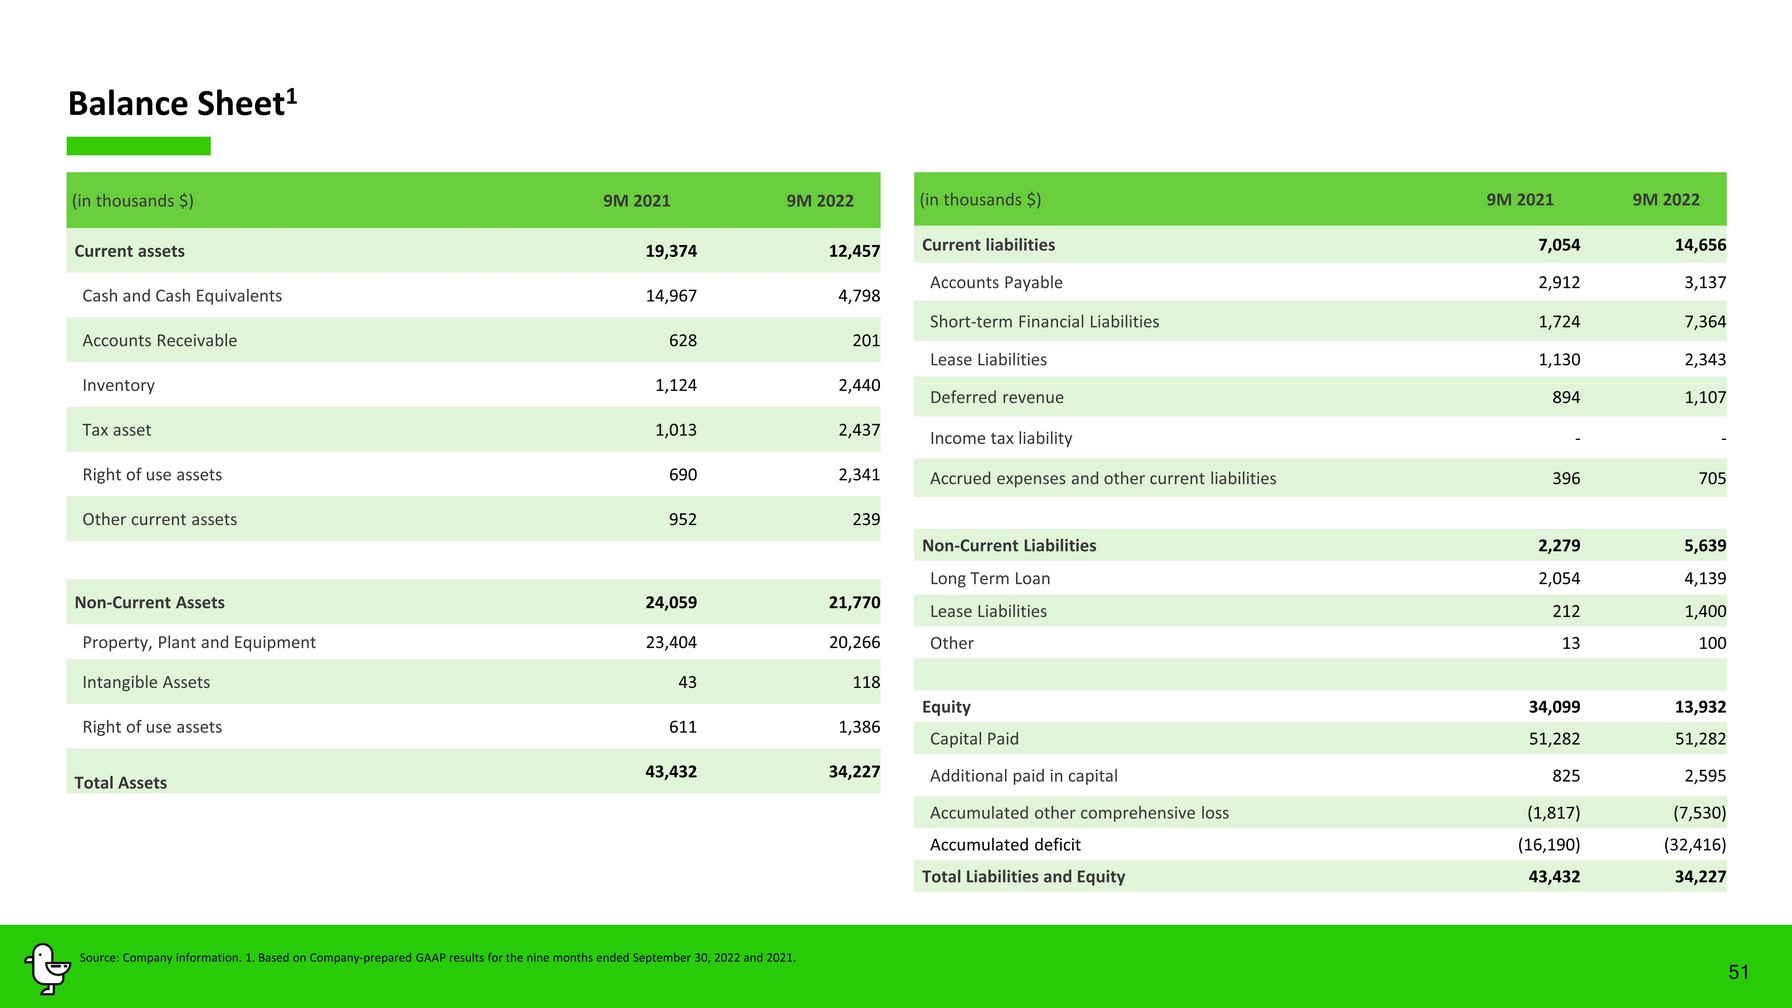
51 Balance Sheet 1 (in thousands $) 9M 202 1 9M 202 2 Current liabilities 7,054 14,656 Accounts Payable 2,912 3,137 Short - term Financial Liabilities 1,724 7,364 Lease Liabilities 1,130 2,343 Deferred revenue 894 1,107 Income tax liability - - Accrued expenses and other c urrent liabilities 396 705 Non - Current Liabilities 2,279 5,639 Long Term Loan 2,054 4,139 Lease Liabilities 212 1,400 Other 13 100 Equity 34,099 13,932 Capital Paid 51,282 51,282 Additional paid in capital 825 2,595 Accumulated other comprehensive loss (1,817) (7,530) Accumulated deficit (16,190) (32,416) Total Liabilities and Equity 43,432 34,227 Source: Company information. 1. Based on Company - prepared GAAP results for the nine months ended September 30, 2022 and 2021. (in thousands $) 9M 202 1 9M 202 2 Current assets 19,374 12,457 Cash and Cash Equivalents 14,967 4,798 Accounts Receivable 628 201 Inventory 1,124 2,440 Tax asset 1,013 2,437 Right of use assets 690 2,341 Other current assets 952 239 Non - Current Assets 24,059 21,770 Property, Plant and Equipment 23,404 20,266 Intangible Assets 43 118 Right of use assets 611 1,386 Total Assets 43,432 34,227

Profit and Loss Statement (in thousands $) 2020 1 9M 2021 2 2021 1 9M 2022 2 Revenue 9,763 13,986 16,999 18,620 Cost of Sales (9,518) (12,491) (16,743) (16,912) Gross Profit 245 1,495 256 1,708 Selling and marketing expenses (257) (1,120) (1,256) (478) General and administration expenses (3,235) (4,284) (6,054) (5,697) Research and development expenses (541) (686) (1,039) (1,308) Other income/expense (Net) (162) (447) (748) (479) Operating loss before finance costs (3,951) (5,042) (8,840) (6,253) Financial income 17 41 180 434 Financial costs (696) (1,084) (4,925) (1,660) Loss before tax (4,630) (6,086) (13,585) (7,479) 52 Source: Company information. Note: : 1. Based on audited GAAP results for the years ended December 31, 2021 and 2020. 2. Based on Company prepared GAAP results for nine months ended September 30, 2022 and 2021.
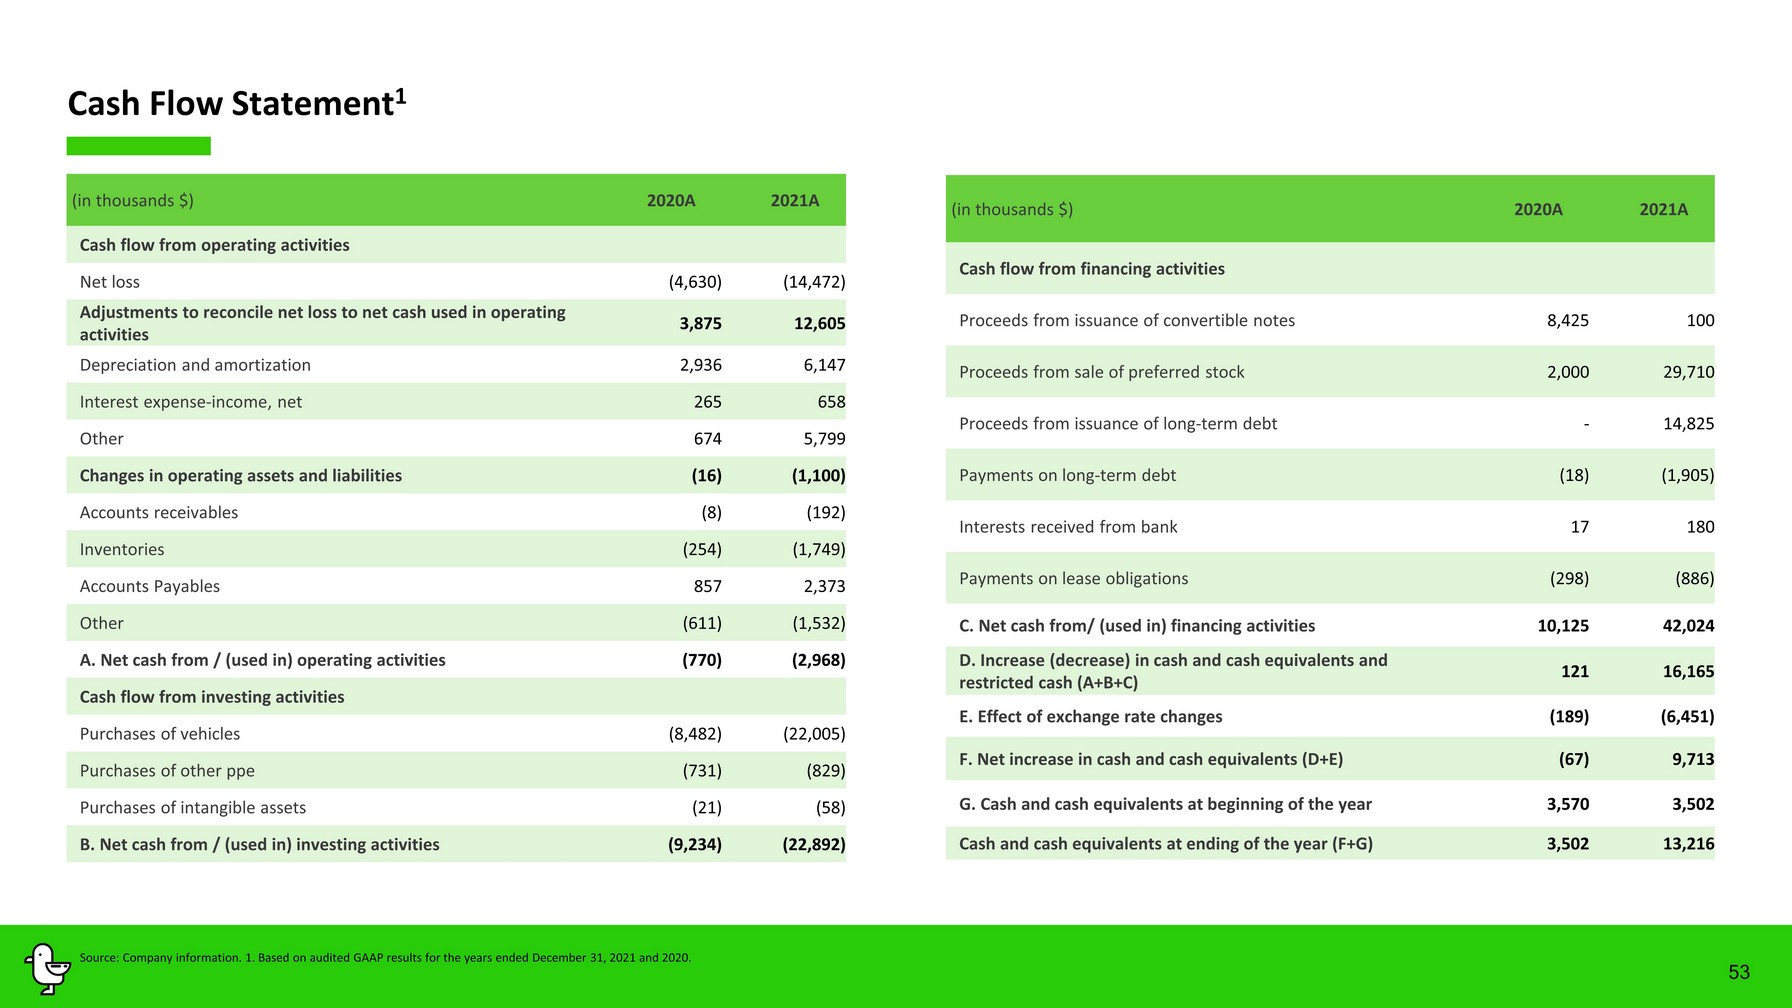
53 Cash Flow Statement 1 Source: Company information. 1. Based on audited GAAP results for the years ended December 31, 2021 and 2020. (in thousands $) 2020A 2021A Cash flow from operating activities Net loss (4,630) (14,472) Adjustments to reconcile net loss to net cash used in operating activities 3,875 12,605 Depreciation and amortization 2,936 6,147 Interest expense - income, net 265 658 Other 674 5,799 Changes in operating assets and liabilities (16) (1,100) Accounts receivables (8) (192) Inventories (254) (1,749) Accounts Payables 857 2,373 Other (611) (1,532) A. Net cash from / (used in) operating activities (770) (2,968) Cash flow from investing activities Purchases of vehicles (8,482) (22,005) Purchases of other ppe (731) (829) Purchases of intangible assets (21) (58) B. Net cash from / (used in) investing activities (9,234) (22,892) (in thousands $) 2020A 2021A Cash flow from financing activities Proceeds from issuance of convertible notes 8,425 100 Proceeds from sale of preferred stock 2,000 29,710 Proceeds from issuance of long - term debt - 14,825 Payments on long - term debt (18) (1,905) Interests received from bank 17 180 Payments on lease obligations (298) (886) C. Net cash from/ (used in) financing activities 10,125 42,024 D. Increase (decrease) in cash and cash equivalents and restricted cash (A+B+C) 121 16,165 E. Effect of exchange rate changes (189) (6,451) F. Net increase in cash and cash equivalents (D+E) (67) 9,713 G. Cash and cash equivalents at beginning of the year 3,570 3,502 Cash and cash equivalents at ending of the year (F+G) 3,502 13,216
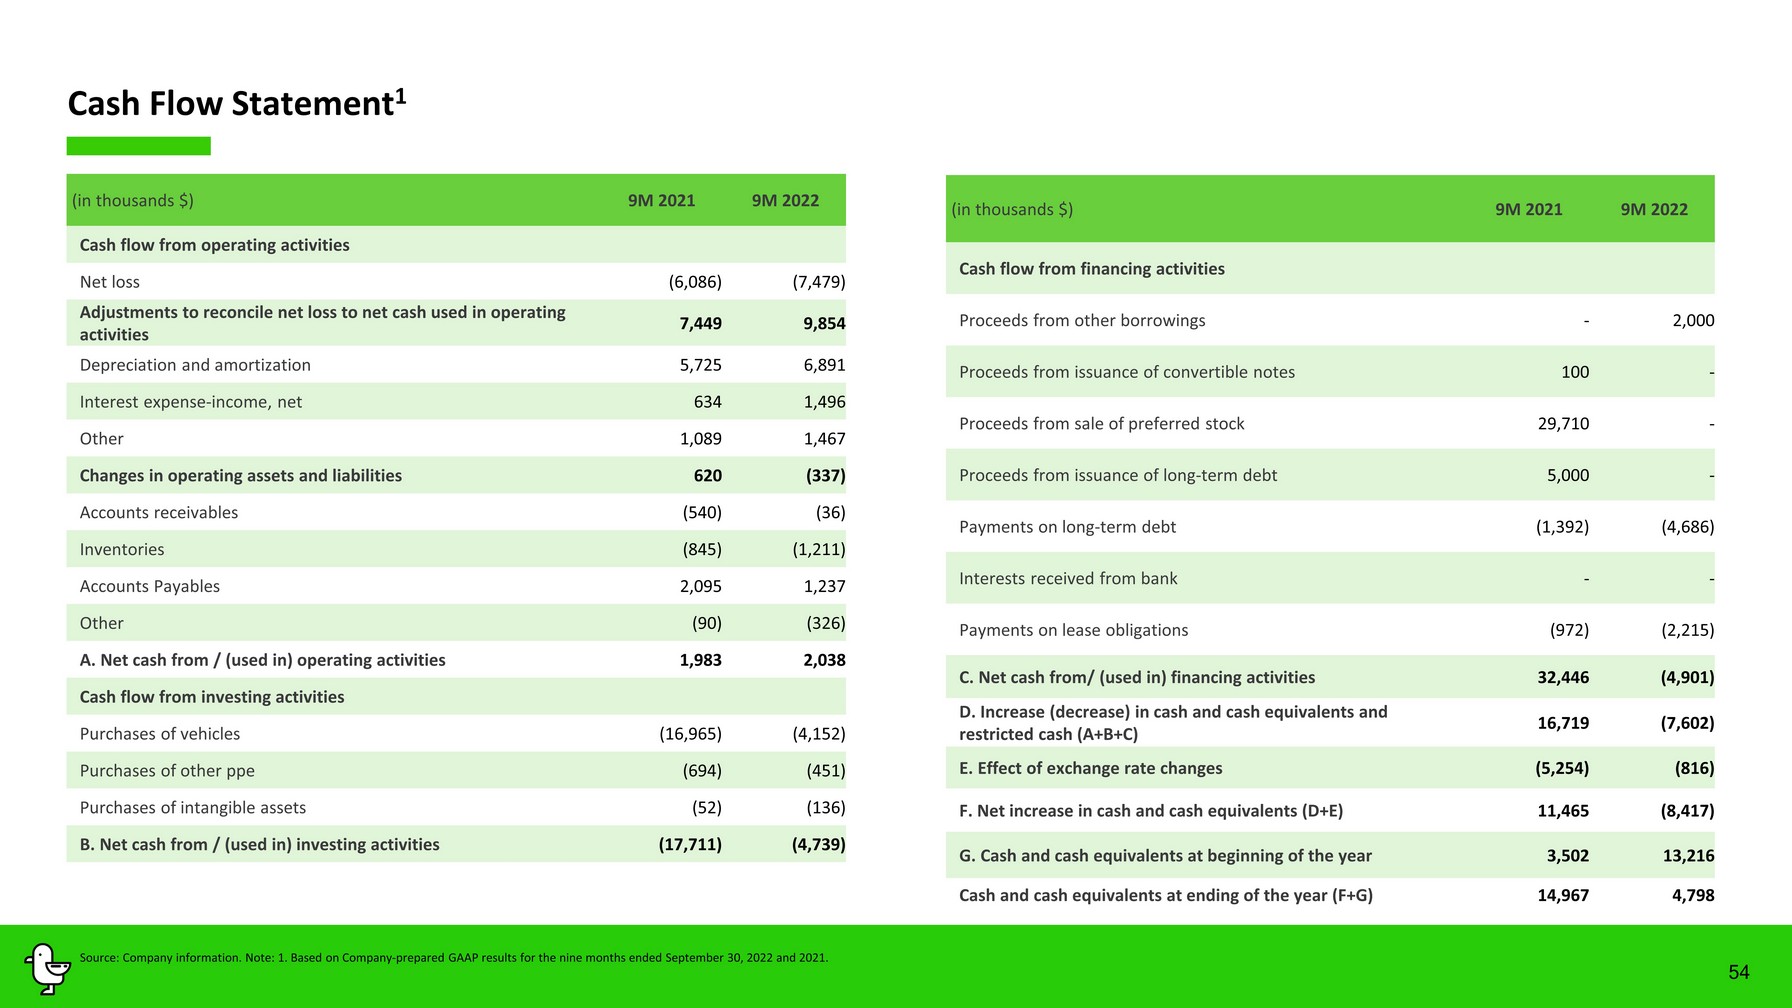
54 Source: Company information. Note: 1. Based on Company - prepared GAAP results for the nine months ended September 30, 2022 and 2021. (in thousands $) 9M 202 1 9M 202 2 Cash flow from operating activities Net loss (6,086) (7,479) Adjustments to reconcile net loss to net cash used in operating activities 7,449 9,854 Depreciation and amortization 5,725 6,891 Interest expense - income, net 634 1,496 Other 1,089 1,467 Changes in operating assets and liabilities 620 (337) Accounts receivables (540) (36) Inventories (845) (1,211) Accounts Payables 2,095 1,237 Other (90) (326) A. Net cash from / (used in) operating activities 1,983 2,038 Cash flow from investing activities Purchases of vehicles (16,965) (4,152) Purchases of other ppe (694) (451) Purchases of intangible assets (52) (136) B. Net cash from / (used in) investing activities (17,711) (4,739) (in thousands $) 9M 202 1 9M 202 2 Cash flow from financing activities Proceeds from other borrowings - 2,000 Proceeds from issuance of convertible notes 100 - Proceeds from sale of preferred stock 29,710 - Proceeds from issuance of long - term debt 5,000 - Payments on long - term debt (1,392) (4,686) Interests received from bank - - Payments on lease obligations (972) (2,215) C. Net cash from/ (used in) financing activities 32,446 (4,901) D. Increase (decrease) in cash and cash equivalents and restricted cash (A+B+C) 16,719 (7,602) E. Effect of exchange rate changes (5,254) (816) F. Net increase in cash and cash equivalents (D+E) 11,465 (8,417) G. Cash and cash equivalents at beginning of the year 3,502 13,216 Cash and cash equivalents at ending of the year (F+G) 14,967 4,798 Cash Flow Statement 1
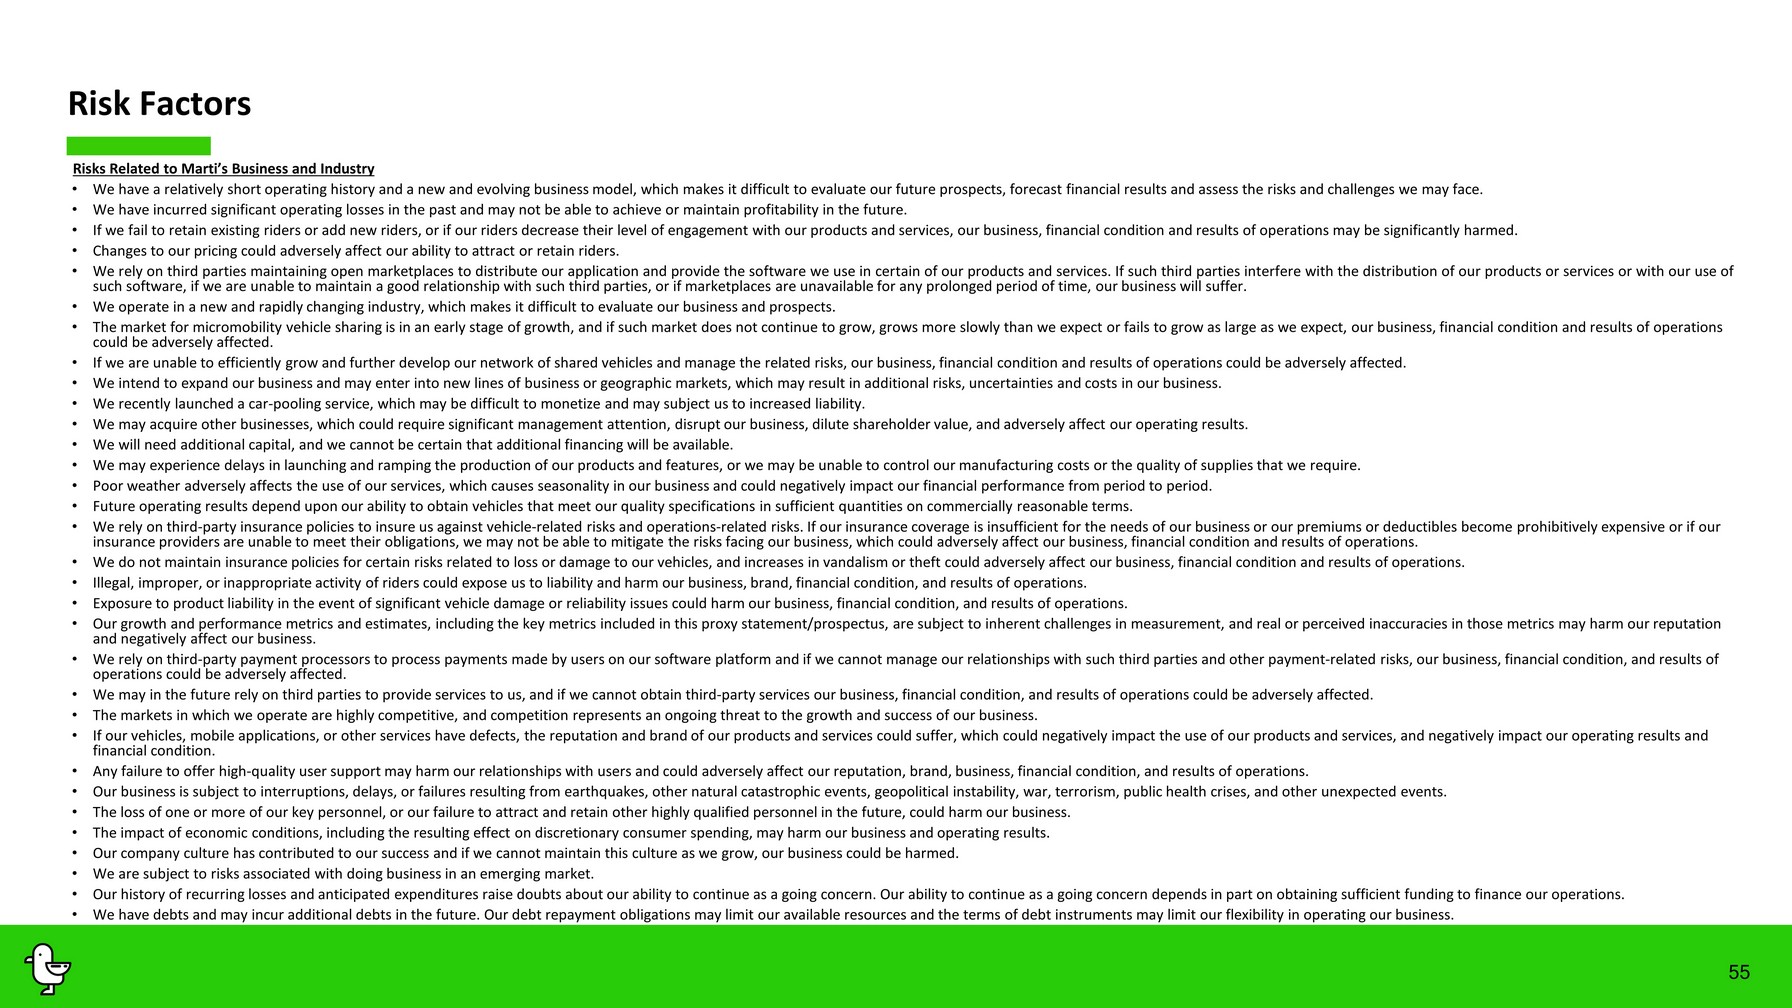
55 Risk Factors Risks Related to Marti’s Business and Industry • We have a relatively short operating history and a new and evolving business model, which makes it difficult to evaluate our future prospects, forecast financial results and assess the risks and challenges we may face . • We have incurred significant operating losses in the past and may not be able to achieve or maintain profitability in the future . • If we fail to retain existing riders or add new riders, or if our riders decrease their level of engagement with our products and services, our business, financial condition and results of operations may be significantly harmed . • Changes to our pricing could adversely affect our ability to attract or retain riders . • We rely on third parties maintaining open marketplaces to distribute our application and provide the software we use in certain of our products and services . If such third parties interfere with the distribution of our products or services or with our use of such software, if we are unable to maintain a good relationship with such third parties, or if marketplaces are unavailable for any prolonged period of time, our business will suffer . • We operate in a new and rapidly changing industry, which makes it difficult to evaluate our business and prospects. • The market for micromobility vehicle sharing is in an early stage of growth, and if such market does not continue to grow, grows more slowly than we expec t or fails to grow as large as we expect, our business, financial condition and results of operations could be adversely affected. • If we are unable to efficiently grow and further develop our network of shared vehicles and manage the related risks, our bus ine ss, financial condition and results of operations could be adversely affected. • We intend to expand our business and may enter into new lines of business or geographic markets, which may result in addition al risks, uncertainties and costs in our business. • We recently launched a car - pooling service, which may be difficult to monetize and may subject us to increased liability . • We may acquire other businesses, which could require significant management attention, disrupt our business, dilute sharehold er value, and adversely affect our operating results. • We will need additional capital, and we cannot be certain that additional financing will be available. • We may experience delays in launching and ramping the production of our products and features, or we may be unable to control ou r manufacturing costs or the quality of supplies that we require. • Poor weather adversely affects the use of our services, which causes seasonality in our business and could negatively impact our financial performance from period to period. • Future operating results depend upon our ability to obtain vehicles that meet our quality specifications in sufficient quanti tie s on commercially reasonable terms. • We rely on third - party insurance policies to insure us against vehicle - related risks and operations - related risks. If our insura nce coverage is insufficient for the needs of our business or our premiums or deductibles become prohibitively expensive or i f o ur insurance providers are unable to meet their obligations, we may not be able to mitigate the risks facing our business, which co uld adversely affect our business, financial condition and results of operations. • We do not maintain insurance policies for certain risks related to loss or damage to our vehicles, and increases in vandalism or theft could adversely affect our business, financial condition and results of operations. • Illegal, improper, or inappropriate activity of riders could expose us to liability and harm our business, brand, financial c ond ition, and results of operations. • Exposure to product liability in the event of significant vehicle damage or reliability issues could harm our business, finan cia l condition, and results of operations. • Our growth and performance metrics and estimates, including the key metrics included in this proxy statement/prospectus, are sub ject to inherent challenges in measurement, and real or perceived inaccuracies in those metrics may harm our reputation and negatively affect our business. • We rely on third - party payment processors to process payments made by users on our software platform and if we cannot manage our relationships with such third parties and other payment - related risks, our business, financial condition, and results of operations could be adversely affected. • We may in the future rely on third parties to provide services to us, and if we cannot obtain third - party services our business, financial condition, and results of operations could be adversely affected. • The markets in which we operate are highly competitive, and competition represents an ongoing threat to the growth and succes s o f our business. • If our vehicles, mobile applications, or other services have defects, the reputation and brand of our products and services c oul d suffer, which could negatively impact the use of our products and services, and negatively impact our operating results and financial condition. • Any failure to offer high - quality user support may harm our relationships with users and could adversely affect our reputation, brand, business, financial condition, and results of operations. • Our business is subject to interruptions, delays, or failures resulting from earthquakes, other natural catastrophic events, geo political instability, war, terrorism, public health crises, and other unexpected events. • The loss of one or more of our key personnel, or our failure to attract and retain other highly qualified personnel in the fu tur e, could harm our business. • The impact of economic conditions, including the resulting effect on discretionary consumer spending, may harm our business a nd operating results. • Our company culture has contributed to our success and if we cannot maintain this culture as we grow, our business could be h arm ed. • We are subject to risks associated with doing business in an emerging market. • Our history of recurring losses and anticipated expenditures raise doubts about our ability to continue as a going concern. O ur ability to continue as a going concern depends in part on obtaining sufficient funding to finance our operations. • We have debts and may incur additional debts in the future. Our debt repayment obligations may limit our available resources and the terms of debt instruments may limit our flexibility in operating our business.
56 Risk Factors • If we breach covenants under our outstanding debts, we could be held in default under such loans, which could accelerate our rep ayment dates and adversely affect our business.The operators of digital storefronts on which we publish our mobile application in many cases have the unilateral ability to change and interpret the terms of our contract with them. • Any actual or perceived security or privacy breach could interrupt our operations and adversely affect our reputation, brand, bu siness, financial condition, and results of operations. • The Convertible Notes to be issued and outstanding after consummation of the Business Combination may have a material adverse eff ect on Galata’s financial results, result in the dilution of Galata’s stockholders and create downward pressure on the price of Galata Class A Ordinary Shares. • COVID - 19 has adversely affected our business and may continue to adversely affect our business. Risks Related to Marti’s Intellectual Property and Technology • Our user growth and engagement on mobile devices depend upon effective operation with mobile operating systems, networks, and st andards that we do not control. • Our future success depends on our ability to keep pace with rapid technological changes that could make our current or future te chnologies less competitive or obsolete. • Our business could be adversely impacted by changes in the Internet and mobile device accessibility of users and unfavorable cha nges in or our failure to comply with existing or future laws governing the Internet and mobile devices. • The operators of digital storefronts on which we publish our mobile application in many cases have the unilateral ability to cha nge and interpret the terms of our contract with them. • We may be parties to intellectual property rights claims and other litigation that are expensive to support, and if resolved adv ersely, could have a significant impact on us and our shareholders. • If we are unable to protect our intellectual property, the value of our brand and other intangible assets may be diminished, and our business may be adversely affected. • Any significant disruption in our services or in our information technology systems could result in a loss of users or harm o ur business. • Damage to, or failure of, our systems or interruptions or delays in service from our third - party cloud service platforms could i mpair the delivery of our service and harm our business. • Our service relies on GPS and other Global Satellite Navigation Systems (“GNSS”). • Computer malware, viruses, hacking, and phishing attacks, and spamming could harm our business and results of operations. • Systems failures and resulting interruptions in the availability of our website, applications, products or services could adv ers ely affect our business, financial condition, and results of operations. Risks Related to Legal Matters and Regulations • Action by governmental authorities to restrict access to our products and services in their localities could substantially ha rm our business and financial results. • Government regulation of the Internet and user privacy is evolving and negative changes could substantially harm our business an d operating results . • We collect, store, process and use personal information and other customer data, which subjects us to governmental regulation an d other legal obligations related to privacy, information security, and data protection, and our actual or perceived failure to comply with such obligations could harm our business. • Expansion of products or services could subject us to additional laws and regulations, and any actual or perceived failure by us to comply with such laws and regulations or manage the increased costs associated with such laws or regulations could adversely affect our business, financial condition, or results of operations. • We are regularly subject to claims, lawsuits, government investigations, and other proceedings that may adversely affect our bus iness, financial condition, and results of operations. • We have faced and are likely to continue to face lawsuits from local governmental entities, municipalities, and private citiz ens related to the conduct of our business. • We are subject to various existing and future environmental health and safety laws and regulations that could result in incre ase d compliance costs or additional operating costs and restrictions. Failure to comply with such laws and regulations may resul t in substantial fines or other limitations that could adversely impact our financial results or operations. • We may be subject to Turkish tax audits that may result in additional tax liabilities. • Our business currently requires us to source parts, materials and supplies internationally, and supply chain disruptions, for eig n currency exchange rate fluctuations and changes to international trade agreements, tariffs, import and excise duties, taxes or other governmental rules and regulations could adversely affect our business, financial condition, results of operations and pro spects. • Because New Marti is incorporated under the laws of the Cayman Islands, you may face difficulties in protecting your interest s, and your ability to protect your rights through the U.S. federal courts may be limited. • The Economic Substance Legislation of the Cayman Islands may impact New Marti. • The Financial Action Task Force’s increased monitoring of the Cayman Islands could impact New Marti. • The Cayman Islands has recently been added to the EU AML high - risk third countries list and it is unclear if and how this design ation will impact New Marti. • We may be subject to fines and the loss of certain tax advantages as a result of investigations by the Turkish customs author ity .
57 Risk Factors Risks Related to Türkiye • Our headquarters and other operations and facilities are located in Türkiye and, therefore, our prospects, business, financial condition and results of operations may be adversely affected by political o r economic instability in Türkiye . • We are subject to certain anti - corruption laws, trade sanctions laws and regulations, and anti - money laundering laws and regulat ions, and we could face criminal liability and other serious consequences for violations, which could harm our business. • Türkiye’s economy is subject to inflation and risks related to its current account deficit. • Risks from events affecting Türkiye’s relationship with the United States. • Foreign exchange rate risks could affect the Turkish macroeconomic environment, could affect your investment and could signif ica ntly affect our results of operation and financial position in future periods if hedging tools are not available at commercia lly reasonable terms. • Türkiye is subject to internal and external unrest and the threat of future terrorist acts, which may adversely affect us. • Türkiye’s economy has been undergoing a significant transformation and remains subject to ongoing structural and macroeconomic risks. • Internet and e - commerce regulation in Türkiye is recent and is subject to further development. • If regional instability were to spread, our operations could be adversely affected. • Türkiye is subject to the risk of significant seismic events . Risks Related to Marti’s Financial Results • We are exposed to fluctuations in currency exchange rates. • We may have exposure to greater than anticipated tax liabilities and may be affected by changes in tax laws or interpretation s, any of which could adversely impact our results of operations. • We are subject to tax in multiple jurisdictions, and changes in tax laws (or in the interpretations thereof) in the Cayman Is lan ds, Türkiye or in other jurisdictions could have an adverse effect on us. • We establish tax provisions, where appropriate, on the basis of amounts expected to be paid to (and recovered from) tax autho rit ies and, as a result, changes in tax laws (or in the interpretations thereof) could have an adverse effect on us. Risks Related to Being a Public Company • New Marti will qualify as an “emerging growth company” and a smaller reporting company, and the reduced disclosure requiremen ts applicable to “emerging growth companies” and smaller growth companies may make its securities less attractive to investors. • The requirements of being a public company may strain New Marti’s resources, divert New Marti management’s attention and affe ct New Marti’s ability to attract and retain qualified board members. • If New Marti fails to put in place appropriate and effective internal control over financial reporting and disclosure control s a nd procedures, it may suffer harm to its reputation and investor confidence levels. • New Marti will qualify as a foreign private issuer within the meaning of the rules under the Exchange Act, and as such New Ma rti is exempt from certain provisions applicable to U.S. domestic public companies. • As an exempted company limited by shares incorporated in the Cayman Islands, New Marti is permitted to adopt certain home cou ntr y practices in relation to corporate governance matters that differ significantly from the NYSE American corporate governance listing standards applicable to domestic U.S. companies; these practices may afford less protection to shareholder s t han they would enjoy if New Marti complied fully with the NYSE American corporate governance listing standards. • An active, liquid trading market for New Marti’s securities may not develop or be sustained. • If securities or industry analysts do not publish research or publish inaccurate or unfavorable research about New Marti’s bu sin ess, the price and trading volume of New Marti’s securities could decline. • New Marti may be subject to securities class action litigation, which may harm its business and operating results. • Galata may redeem the Public Warrants prior to their exercise or expiration at a time that is disadvantageous to Public Warra nt holders, thereby making their Public Warrants worthless, and exercise of a significant number of the Public Warrants could adversely affect the market price of Class A Ordinary Shares. • Subsequent to the completion of the Business Combination, New Marti may be required to take write downs or write offs, restru ctu ring and impairment or other charges that could have a significant negative effect on New Marti’s financial condition, results of operations and share price, which could cause you to lose some or all of your investment. • Following the consummation of the Business Combination, New Marti’s only significant asset will be its ownership of Marti and it s affiliates and such ownership may not be sufficient to pay dividends or make distributions or obtain loans to enable New Marti to pay any dividends on its Class A Ordinary Shares or satisfy other financial obligations.
58 Risk Factors Risks Related to Galata and the Business Combination • Because New Marti will become a publicly traded company by virtue of the Business Combination as opposed to an underwritten i nit ial public offering, the process does not use the services of one or more underwriters, which could result in less diligence being conducted. • Past performance by the Sponsor or its affiliates, or the directors and officers of Galata, may not be indicative of future p erf ormance of an investment in Galata or New Marti. • Galata and Marti may require additional financing prior to completion of the Business Combination in order to satisfy the con dit ions to consummation of the Business Combination, which additional financing may not be able to be obtained. • Galata and Marti may require additional financing prior to completion of the Business Combination in order to satisfy the con dit ions to consummation of the PIPE Subscription, which additional financing may not be able to be obtained. • Activities taken by existing Galata shareholders to increase the likelihood of approval of the Business Combination proposal and the other proposals could have a depressive effect on our Class A Ordinary Shares. • Galata shareholders will experience dilution as a consequence of, among other transactions, the issuance of Class A Ordinary Sha res as consideration in the Business Combination and the conversion of the Convertible Notes. Having a minority share position may reduce the influence that Galata’s current shareholders have on the management of Galata. • If Galata is unable to complete the Initial Business Combination prior to July 9, 2023, they will cease all operations except fo r the purpose of winding up, redeeming 100% of the outstanding public shares and, subject to the approval of its remaining shareholders and the Galata Board, dissolving and liquidating. In such event, third parties may bring claims against Galata a nd, as a result, the proceeds held in the Trust Account could be reduced. • Following the consummation of the Business Combination, New Marti’s sole material asset will be its direct and indirect inter est s in its subsidiaries and, accordingly, New Marti will be dependent upon distributions from its subsidiaries to pay taxes and cover its corporate and other overhead expenses and pay dividends, if any, on Class A Ordinary Shares. • The Galata Founder Shareholders have agreed to vote in favor of the Business Combination, regardless of how Galata’s public s har eholders vote. • The Galata Founder Shareholders and certain of Galata’s directors and officers have interests in the Business Combination tha t a re different from, or in addition to, those of other shareholders generally, and Galata’s directors were aware of and considered such interests, among other matters, in recommending that shareholders vote in favor of approval of the Proposals. • Galata Founder Shareholders hold a significant number of Founder Shares and the Sponsor holds a significant number of Private Pl acement Warrants. They will lose their entire investment in Galata if Galata does not complete the Initial Business Combination. • Galata will incur significant transaction costs in connection with the Business Combination. • Marti may be subject to business uncertainties while the Business Combination is pending. • The unaudited pro forma condensed combined financial information included in this proxy statement/prospectus may not be indic ati ve of what New Marti’s actual financial position or results of operations will be. • The consummation of the Business Combination is subject to a number of conditions and if those conditions are not satisfied o r w aived, the Business Combination Agreement may be terminated in accordance with its terms and the Business Combination may not be completed. • Galata may waive one or more of the conditions to the Business Combination. • The exercise of discretion by Galata’s directors and officers in agreeing to changes to the terms of, or waivers of closing c ond itions in, the Business Combination Agreement may result in a conflict of interest when determining whether such changes to t he terms of the Business Combination Agreement or waivers of conditions are appropriate and in the best interests of Galata’s sh are holders. • The process of taking a company public by means of a business combination with a special purpose acquisition company (“SPAC”) is different from taking a company public through an underwritten offering and may create risks for our unaffiliated investors. • If third parties bring claims against Galata, the proceeds held in the Trust Account could be reduced and the per share redem pti on amount received by Galata’s shareholders may be less than $10.00 per share. • Galata’s directors may decide not to enforce the indemnification obligations of the Sponsor, resulting in a reduction in the amo unt of funds in the Trust Account available for distribution to Galata’s public shareholders. • Galata may not have sufficient funds to satisfy indemnification claims of its directors and officers. • If, after Galata distributes the proceeds in the Trust Account to Galata’s public shareholders, Galata files a bankruptcy pet iti on or an involuntary bankruptcy petition is filed against Galata that is not dismissed, a bankruptcy court may seek to recove r s uch proceeds, and the members of the Galata Board may be viewed as having breached their fiduciary duties to Galata’s creditors, the reby exposing the members of the Galata Board and Galata to claims of punitive damages. • If, before distributing the proceeds in the Trust Account to Galata’s public shareholders, Galata files a bankruptcy petition or an involuntary bankruptcy petition is filed against Galata that is not dismissed, the claims of creditors in such proceeding ma y have priority over the claims of Galata’s shareholders and the per - share amount that would otherwise be received by Galata’s sha reholders in connection with Galata’s liquidation may be reduced. • Even if Galata consummates the Business Combination, there is no guarantee that the Public Warrants will be in the money at t he time they become exercisable, and they may expire worthless. • Galata may amend the terms of its Public Warrants in a manner that may be adverse to holders of Public Warrants with the appr ova l by the holders of at least 50% of the then - outstanding Public Warrants. As a result, the exercise price of the Public Warrants could be increased, the exercise period could be shortened and the number of Class A Ordinary Shares purchasable upo n e xercise of a Public Warrant could be decreased, all without a holder’s approval. • Galata may redeem unexpired Galata Warrants prior to their exercise at a time that is disadvantageous to warrant holders, the reb y making their warrants worthless. • Because certain of the Class A Ordinary Shares and Public Warrants currently trade as Galata Units consisting of one Class A Ord inary Share and one - half of one warrant, the Galata Units may be worth less than units of other blank check companies. • Galata may issue a substantial number of additional Class A Ordinary Shares or Galata preference shares to complete the Busin ess Combination or under an employee incentive plan after completion of the Business Combination. Any such issuances would dilute the interest of Galata’s shareholders and likely present other risks.
59 Risk Factors • The NYSE American may delist New Marti’s securities from trading on its exchange, which could limit investors’ ability to mak e t ransactions in New Marti’s securities and subject New Marti to additional trading restrictions. • Galata cannot assure you that its diligence review has identified all material risks associated with the Business Combination , a nd you may be less protected as an investor from any material issues with respect to New Marti’s business, including any material omissions or misstatements contained in the registration statement or proxy statement/prospectus relating to the Bus ine ss Combination than an investor in an initial public offering. • A significant portion of Galata’s total outstanding shares may not be immediately resold but may be sold into the market in t he near future. This could cause the market price of the Class A Ordinary Shares to drop significantly, even if Galata’s busines s i s doing well. • If the Business Combination’s benefits do not meet the expectations of investors, shareholders or financial analysts, the mar ket price of Galata’s securities may decline. • The Sponsor or Galata’s directors, officers, advisors or any of their respective affiliates may elect to purchase Galata’s pu bli c shares from public shareholders, which may influence the vote on the Proposals and reduce the public “float” of the Class A Ordinary Shares. • The Galata Warrants and Founder Shares may have an adverse effect on the market price of the Class A Ordinary Shares and make it more difficult to effectuate the Business Combination. • Barclays was to be compensated as a financial and capital markets advisor to Marti in connection with the Business Combinatio n. Barclays, gratuitously and without any consideration from Galata or Marti, waived such compensation and disclaimed any responsibility for this proxy statement/prospectus. • If the funds not being held in the trust account are insufficient to allow us to operate for at least the 24 months following th e closing of our initial offering, we may be unable to complete our initial business combination. • We have concluded that Galata’s disclosure controls and procedures were not effective as of September 30, 2021. If we are una ble to develop and maintain an effective system of internal control over financial reporting, we may not be able to accurately report our financial results in a timely manner, which may adversely affect investor confidence in us and materially and adve rse ly affect our business and operating results. Risks Related to the Redemption • There is no guarantee that a shareholder’s decision whether to redeem its shares for a pro rata portion of the Trust Account wil l put the shareholder in a better future economic position. • If Galata’s shareholders fail to comply with the redemption requirements specified in this proxy statement/prospectus, they w ill not be entitled to redeem their Class A Ordinary Shares for a pro rata portion of the funds held in the Trust Account. • Shareholders who wish to redeem their shares for a pro rata portion of the Trust Account must comply with specific requiremen ts for redemption that may make it more difficult for them to exercise their redemption rights prior to the deadline. • If a public shareholder fails to receive notice of Galata’s offer to redeem its public shares in connection with the Business Combination,or fails to comply with the procedures for tendering its shares, such shares may not be redeemed. • Galata does not have a specified maximum redemption threshold. The absence of such a redemption threshold may make it possibl e f or Galata to complete the Business Combination even if a substantial majority of Galata’s shareholders do not agree. • If Galata is unable to consummate the Business Combination or any other Initial Business Combination prior to July 9, 2023, t he public shareholders may be forced to wait beyond such date before redemption from the Trust Account. • Galata is expected to be treated as a U.S. domestic corporation for U.S. federal income tax purposes as a result of the Merge r. • Certain investors may be required to recognize gain for U.S. federal income tax purposes as a result of the Deemed Domesticat ion or subject to U.S. withholding tax. • A new 1% U.S. federal excise tax could be imposed on us in connection with the redemptions of Class A Ordinary Shares.

LET’S RIDE!