
Filed by Galata Acquisition Corp.
Pursuant to Rule 425 under the Securities Act of 1933
and deemed filed pursuant to Rule 14a-12
under the Securities Exchange Act of 1934
Subject Company: Galata Acquisition Corp.
Commission File No.: 001-40588
Date: November 1, 2022
This filing is being made to correct certain arithmetic errors included in the filing made with the Securities and Exchange Commission on October 26, 2022 pursuant to Rule 425.
Marti Reports Strong Third Quarter 2022 Financial Results
Istanbul, Turkey – October 26, 2022 - Marti Technologies Inc. (“Marti” or the “Company”), Turkey’s leading mobility app, today announced its financial results for the third quarter ended September 30, 2022.
The Company delivered strong financial performance in the third quarter as net revenue increased by 23% to $8.9 million as compared to the same period in 2021, while adjusted EBITDA1 decreased by 38% as compared to the same period in 2021 with an adjusted EBITDA margin of 17% primarily due to the effects of inflation on operating expenses.
Marti Founder and Chief Executive Officer Alper Oktem said: “We continued to scale our fleet in the third quarter of 2022, with 36,176 average daily vehicles deployed and 3.11 average daily rides per vehicle across our fleet. With continued rational pricing in line with the depreciation of the Turkish lira relative to the U.S. dollar, we achieved net revenue for the quarter of $8.9 million, in line with our forecast. We also began strengthening our senior management team, added new team members in key roles, including on our Vehicles and Investor Relations teams and reached agreements with several additional senior leaders and department heads who will join us in the fourth quarter. As a result of investing in talent across our organization, and with increased advisory expenses in connection with our business combination with Galata Acquisition Corp. (NYSE: GLTA) (“Galata”), a special purpose acquisition company, our general and administrative expenses for the quarter came in higher than forecasted. Our personnel cost increased as a result of two minimum wage increases in Turkey this year in response to continued inflation. However, this rise in operating expenses was partly offset by our pricing actions in September. We plan to continue to focus on balanced growth in our operations led by our accomplished management team.
YTD 2022 Financial and Operational Highlights
| · | Consolidated net revenue increased 39% compared to the same period in 2021 to $18.8 million as a result of expansion of our fleet size. |
| · | Operating costs, excluding depreciation and amortization, increased by 61% compared to the same period in 2021 to $11.6 million, as minimum wage increases due to high inflation drove personnel cost upwards and consolidation of distinct teams for each modality was [delayed]. |
| · | Adjusted EBITDA decreased by 61% to $764 thousand compared to the same period in 2021, and adjusted EBITDA margin decreased to 4%, as a result of increased operational, general and administrative, and business combination advisory expenses, as well as expansion of our operations. |
| · | Despite the decrease in Adjusted EBITDA compared to the same period in 2021, Adjusted EBITDA exceeded our 2022 YTD forecast by 443%. |
| · | Prices increased by 47% compared to the same period in 2021, exceeding the 39% depreciation of the Turkish Lira relative to the U.S. dollar. |
1 EBITDA, adjusted EBITDA and EBITDA margin are not measures of financial performance prepared in accordance with GAAP. See “Financial Information: Non-GAAP Financial Measures” for a discussion of EBITDA, adjusted EBITDA and EBITDA margin, and a reconciliation of net loss and net loss margin, the most comparable GAAP measures, to adjusted EBITDA and EBITDA margin, respectively.
Third Quarter 2022 Financial and Operational Highlights
| · | Net revenue increased 23% to $8.9 million in Q3’22, compared to $7.3 million in Q3’21, as a result of expansion of our fleet size through completion of e-bike deployment ahead of schedule and rational pricing actions in response to increased inflation and local currency devaluation. |
| · | Operating expenses, excluding depreciation and amortization, increased by 59% to $4.8 million, compared to $3.0 million in Q3’21, which is higher than our Q3’22 forecast of $4.1 million due to the expansion in teams for each new modality in line with the growth in fleet size, as well as inflationary pressures resulting in an increase to the minimum wage in Turkey. |
| · | General and administrative expenses increased by 43% to $2.8 million in Q3’22, compared to $2.0 million in Q3’21, due to our investment in talent to enhance the capabilities of our management team and increased advisory expenses prior to listing. |
| · | Adjusted EBITDA decreased by 38% compared to the same period in 2021 to $1.5 million with an adjusted EBITDA margin of 17% for Q3’22, compared to $2.4 million in Q3’21. |
| · | We increased prices by 10% quarter over quarter parallel to the currency devaluation of the Turkish lira by 11% during the quarter. |
| · | Average daily vehicles deployed increased to 36.2 thousand in Q3’22 compared to 17.9 thousand in Q3’21 as our fleet size more than doubled, including the addition of new modalities. |
| · | Average daily rides per vehicle decreased by 28% compared to Q3’21 due to the temporary spike in demand following the end of the COVID-19 curfew in Q3’21. |
| · | Average net revenue per ride decreased by 16% to $0.90 in Q3’22, compared to $1.02 in Q3’21, due to the increase in the percentage of commute rides relative to leisure rides, which reduced average ride durations by 20%. Conversely, the rise in commute rides contributed to increased customer retention of 4.7 monthly rides per unique rider. |
| · | We assembled and deployed 4,000 e-scooters and e-bikes during the quarter. |
| · | We launched e-bike operations in Cesme, Isparta and Kocaeli. |
| · | Monthly theft and vandalism rates on our fleet remained below 0.1%. |
| · | We continued to build out our management team to support commercial growth opportunities. During Q3’22, we added 68 new employees at our headquarters, including department heads for our Vehicles and Investor Relations teams. As of September 30, 2022, we had a 194-person team at our headquarters and 950 field team members. We continue to prioritize investments in talent, including senior management roles. |
“We were encouraged by the continued growth in our monthly rides per unique rider as we scaled our fleet, both in size and by diversifying our modalities.” said Alper Oktem, Founder and Chief Executive Officer of Marti. “Our balanced financial and operational performance in Q3’22 is a testament to our innovative strategy, robust demand for our services and our ability to scale.
“In our first four years, we have achieved significant traction for our mobility products, strong growth, and unit profitability. As the number one mobility app in Turkey across iOS and Android app stores, operating in one of the world’s twenty largest economies, which is home to over 80 million people, we are uniquely positioned for growth.
“To continue to drive our growth, on August 1, 2022, we announced the execution of a definitive business combination agreement with Galata. As of June 30, 2022, Galata had $146.6 million in trust and the parties have received commitments for $57.5 million in new investments, in the form of convertible notes, and are seeking to raise an additional $92.5 million in new investments prior to the closing of the business combination. The closing of the proposed transaction with Galata will provide access to the U.S. capital markets and leave us well-positioned to seek to become Turkey’s first mobility super-app by expanding into other attractive adjacencies, leveraging our growing and loyal customer base,” concluded Oktem.
Balanced financial performance in Q3’22
With higher than expected top-line growth in the second quarter of 2022 and growth in line with expectations in this third quarter, we hit our revenue forecast in Q3’22. As expected, the continued high inflation in Turkey affected our operating expenses. A second annual rise in minimum wage at mid-year and our relatively delayed pricing response resulted in EBITDA performance below expectation for the third quarter. However, our YTD performance illustrates our cost-effective approach in our business model, as both operational expenses and general and administrative expenses were below our forecast. However, inflationary pressures and the possibility of further devaluation of the Turkish lira makes us cautious in revising our expectation for 2022.
Customer Retention
Commute ridership increased as modalities continue to gain longevity and availability in the field. Average monthly rides per unique rider reached a record high of 4.7 in Q3’22, up from 4.2 and 3.5 in Q3’21 and Q3’20, respectively. Average daily vehicles deployed increased to 36.2 thousand in Q3’22, up from 17.9 thousand in Q3’21.
In addition, multi-modal riders take 3.6X more rides and spend 3.6X more than single modality riders, which supports our intention to scale our fleet across modalities in the future.
Financial Information; Non-GAAP Financial Measures
The financial information and data contained in this Press Release is unaudited and does not conform to Regulation S-X promulgated under the U.S. Securities Act of 1933, as amended. Accordingly, such information and data may not be included in, may be adjusted in or may be presented differently in, any registration statement or proxy statement/prospectus to be filed by Galata with the U.S. Securities and Exchange Commission.
This financial information and data contained herein are not presented in accordance with generally accepted accounting principles of the United States (“GAAP”) including, but not limited to, adjusted EBITDA and certain ratios and other metrics derived therefrom. We define these metrics as follows:
Adjusted EBITDA as net income (loss) plus non-operating income (loss), depreciation and amortization, net interest expense, income taxes, stock-based compensation and transaction costs.
Adjusted EBITDA margin as adjusted EBITDA/net revenue
These non-GAAP financial measures are not measures of financial performance in accordance with GAAP and may exclude items that are significant in understanding and assessing the Company’s financial results. Therefore, these measures should not be considered in isolation or as an alternative to net income, cash flows from operations or other measures of profitability, liquidity or performance under GAAP. You should be aware that the Company’s presentation of these measures may not be comparable to similarly titled measures used by other companies. The Company believes these non-GAAP measures of financial results provide useful information for management and investors regarding certain financial and business trends relating to the Company’s financial condition and results of operations. The Company believes the use of these non-GAAP financial measures provides an additional tool for investors to use in evaluating ongoing operating results and trends and in comparing the Company’s financial measures with other similar companies, many of which present similar non-GAAP financial measures to investors. These non-GAAP financial measures are subject to inherent limitations as they reflect the exercise of judgments by management about which expense and income are excluded or included in determining these non-GAAP financial measures and accordingly, should always be considered as supplemental financial results to those calculated in accordance with GAAP.
This financial information and data contained herein also includes certain projections of non-GAAP financial measures. Due to the high variability and difficulty in making accurate forecasts and projections of some of the information excluded from these projected measures, together with some of the excluded information not being ascertainable or accessible, the Company is unable to quantify certain amounts that would be required to be included in the most directly comparable GAAP financial measures without unreasonable effort. Consequently, no disclosure of estimated comparable GAAP measures is included and no reconciliation of the forward-looking non-GAAP financial measures is included.
About Marti
Marti launched operations in 2019 with the goal of offering tech-enabled urban transportation services to riders across Turkey. We operate the country’s largest fleet of e-mopeds, e-bikes, and e-scooters, serviced by proprietary software systems and IOT infrastructure, and we are the number one travel app in Turkey across iOS and Android app stores. We offer environmentally sustainable transportation services, that are currently delivered via fully electric vehicles, to our riders in an economically sustainable manner. For more information visit ir.marti.tech.
Important Additional Information and Where to Find It
In connection with the proposed business combination, Galata Acquisition Corp. (“Galata”) and Marti Technologies, Inc. (“Marti”) intend to file a registration statement on Form F-4 (the “Registration Statement”) with the Securities and Exchange Commission, which will include a proxy statement/prospectus and certain other related documents.
INVESTORS AND SECURITY HOLDERS ARE URGED TO READ THE REGISTRATION STATEMENT, PROXY STATEMENT/PROSPECTUS, ANY AMENDMENTS OR SUPPLEMENTS THERETO AND ANY OTHER RELEVANT DOCUMENTS TO BE FILED WITH THE SEC IN CONNECTION WITH THE PROPOSED BUSINESS COMBINATION CAREFULLY AND IN THEIR ENTIRETY, WHEN THEY BECOME AVAILABLE, BECAUSE THEY WILL CONTAIN IMPORTANT INFORMATION ABOUT GALATA, MARTI AND THE PROPOSED BUSINESS COMBINATION.
When available, the definitive proxy statement/prospectus and other relevant materials for the proposed business combination will be mailed to stockholders of Galata as of a record date to be established for voting on the proposed business combination. Security holders and investors will also be able to obtain copies of the Registration Statement, proxy statement/prospectus and other documents filed with the SEC that will be incorporated by reference therein, without charge, once available, at the SEC’s website at www.sec.gov. Documents filed with the SEC by Galata will also be available free of charge by accessing Galata’s website at https://www.galatacorp.net, or, alternatively, by directing a request by mail to Galata at 2001 S Street NW, Suite 320, Washington, DC 20009.
Participants in the Solicitation
Galata and Marti and certain of their respective directors and executive officers and other members of management and employees may be deemed to be participants in the solicitation of proxies with respect to the proposed business combination under the rules of the SEC. Information about Galata’s directors and executive officers is contained in Galata’s Annual Report on Form 10-K for the fiscal year ended December 31, 2021, as filed with the SEC pursuant to Section 13 of the Securities Exchange Act of 1934, as amended, on March 31, 2022, which is available free of charge at the SEC’s website at www.sec.gov or by directing a request to Galata at 2001 S Street NW, Suite 320, Washington, DC 20009. Additional information regarding the participants in the proxy solicitation and a description of their direct and indirect interests, by security holdings or otherwise, will be contained in the proxy statement/prospectus and other relevant materials to be filed with the SEC regarding the proposed business combination when they become available. Investors should read the proxy statement/prospectus carefully when it becomes available before making any voting or investment decisions. You may obtain free copies of these documents from the sources indicated above.
No Offer or Solicitation
This communication shall not constitute an offer to sell or the solicitation of a proxy, consent, or authorization with respect to or an offer to buy any securities in respect of the proposed business combination, nor shall there be any sale of securities in any jurisdiction in which such offer, solicitation or sale would be unlawful prior to registration or qualification under the securities laws of any such jurisdiction. No offering of securities shall be made except by means of a prospectus meeting the requirements of Section 10 of the U.S. Securities Act of 1933, as amended, or an exemption therefrom.
Cautionary Statement Regarding Forward-Looking Information
This communication contains statements that are not based on historical fact and are “forward-looking statements’’ within the meaning of the “safe harbor” provisions of the Private Securities Litigation Reform Act of 1995. For example, statements about the expected timing of the completion of the proposed business combination, the benefits of the proposed business combination, the competitive environment, and the expected future performance and market opportunities of Marti are forward-looking statements. In some cases, you can identify forward looking statements by terminology such as, or which contain the words “will,” “aim,” “anticipate,” “believe,” “continue,” “could,” “estimate,” “expect,” “forecast,” “future,” “intend,” “may,” “plan,” “possible,” “predict,” “project,” “seek,” “should,” “target,” “will,” “would” and variations of these words or similar expressions. Such forward-looking statements are subject to risks, uncertainties and other factors. Actual results may differ materially from the expectations expressed or implied in the forward-looking statements as a result of known and unknown risks and uncertainties.
These forward-looking statements are based on estimates and assumptions that, while considered reasonable by Marti and its management are inherently uncertain and are subject to a number of risks and assumptions. These statements are not guarantees of future performance and are subject to risks, uncertainties and other factors, some of which are beyond Marti’s control, are difficult to predict, and could cause actual results to differ materially from those expressed or forecasted in the forward-looking statements. Known risks and uncertainties include but are not limited to: (1) the occurrence of any event, change or other circumstances that could give rise to the termination of the business combination agreement; (2) the outcome of any legal proceedings that may be instituted against Marti, Galata, the combined company or others following the announcement of the proposed business combination; (3) the inability to complete the proposed business combination in a timely manner or at all (including due to the failure to obtain approval of the stockholders of Galata or to satisfy other conditions to closing); (4) changes to the proposed structure of the proposed business combination that may be required or appropriate as a result of applicable laws or regulations; (5) the ability to meet applicable stock exchange listing standards at or following the consummation of the proposed business combination; (6) the risk that the proposed business combination disrupts current plans and operations of Marti as a result of the announcement and consummation of the proposed business combination; (7) the ability to recognize the anticipated benefits of the proposed business combination, which may be affected by, among other things, competition, the ability of the combined company to grow and manage growth profitably, maintain relationships with customers and suppliers and retain its management and key employees; (8) costs related to the proposed business combination, including the amount of cash available following any redemptions by Galata stockholders; (9) changes in applicable laws or regulations; (10) the possibility that Marti or the combined company may be adversely affected by other economic, business and/or competitive factors; (11) risks relating to Marti’s operating history and the mobile transportation industry; (12) risks associated with doing business in an emerging market; (13) risks relating to Marti’s dependence on and use of certain intellectual property and technology; and (14) other risks and uncertainties set forth in the Registration Statement to be filed by Galata with the SEC in connection with the proposed business combination. The foregoing list of important factors is not exhaustive and you should carefully consider the other risks and uncertainties described in the “Risk Factors” section of Galata’s Annual Report on Form 10-K, Quarterly Reports on Form 10-Q and other documents filed by Galata from time to time with the SEC.
Nothing herein should be regarded as a representation by any person that the forward-looking statements set forth herein will be achieved or that any of the contemplated results of such forward-looking statements will be achieved. You should not place undue reliance on forward-looking statements, which speak only as of the date they are made. Except as may be required by applicable law, neither Marti nor Galata undertakes any duty to update or revise any forward-looking statements whether as a result of new information, new events, future events or circumstances, or otherwise.
Investor Relations Contact:
Ozge Arcasoy
Marti Technologies Inc.
ir.marti.tech
Interim Financials:
| Q2 2021 | Q2 2022 | ∆ | Q3 2021 | Q3 2022 | ∆ | 2021 YTD | 2022 YTD | ∆ | |
| Average Daily Vehicles Deployed | 18,685 | 29,260 | 57% | 17,877 | 36,176 | 102% | 16,278 | 31,290 | 92% |
| Average Daily Rides per Vehicle | 2.50 | 2.97 | 19% | 4.32 | 3.11 | (28)% | 2.90 | 2.54 | (12)% |
| Average Net Revenue per Ride (USD) | 1.08 | 0.90 | (17)% | 1.02 | 0.87 | (16)% | 1.05 | 0.87 | (17)% |
| Net Revenue (USD, thousands) | 4,593 | 7,122 | 55% | 7,263 | 8,943 | 23% | 13,555 | 18,819 | 39% |
| Operating Costs, excl. D&A (USD, thousands) |
(2,487) | (3,795) | 53% | (3,009) | (4,778) | 59% | (7,243) | (11,675) | 61% |
| % of Net Revenue | 54% | 53% | 41% | 53% | 53% | 62% | |||
| G&A (USD, thousands) | (1,292) | (2,035) | 58% | (1,966) | (2,804) | 43% | (4,597) | (6,676) | 45% |
| % of Net Revenue | 28% | 29% | 27% | 31% | 34% | 35% | |||
| Adj. EBITDA (USD, thousands) 1 | 883 | 1,384 | 57% | 2,373 | 1,483 | (38)% | 1,929 | 764 | (61)% |
| Adj. EBITDA Margin | 19% | 19% | 33% | 17% | 14% | 4% |
Adjusted EBITDA Reconciliation:
| (USD, thousands) | Q2 2021 | Q2 2022 | Q3 2021 | Q3 2022 | 2021 YTD | 2022 YTD |
| Gross Profit (post-depreciation) | 989 | 1,113 | 2,405 | 1,230 | 2,969 | 957 |
| Fleet depreciation | 1,117 | 2,214 | 1,849 | 2,935 | 3,343 | 6,186 |
| Gross Profit (pre-depreciation) | 2,107 | 3,327 | 4,254 | 4,165 | 6,312 | 7,143 |
| Selling and marketing expenses | (39) | (172) | (415) | (251) | (506) | (494) |
| General and administration expenses | (1,199) | (1,857) | (1,537) | (2,541) | (3,563) | (5,539) |
| Research and development expenses | (54) | (6) | (14) | (12) | (99) | (50) |
| Depreciation and amortization expenses | 68 | 92 | 85 | 122 | 214 | 297 |
| Adj. EBITDA | 883 | 1,384 | 2,373 | 1,483 | 1,929 | 764 |
TURKEY’S LEADING MOBILITY APP Q 3 2022 INVESTOR PRESENTATION
About this Presentation This confidential presentation (this “Presentation”) is for informational purposes only to assist interested parties in making their own evaluation with respect to an investment in connection with a possible transaction (the “Business Combination”) involving Marti Technologies Inc . (“Marti” or the “Company”) and Galata Acquisition Corp . (“Galata” or “SPAC”), and for no other purpose . The information contained herein does not purport to be all - inclusive and none of Galata, the Company or their respective representatives or affiliates makes any representation or warranty, express or implied, as to the accuracy, completeness or reliability of the information contained in this Presentation . This Presentation and any oral statements made in connection with this Presentation do not constitute (i) a solicitation of a proxy, consent or authorization with respect to any securities or in respect of the proposed Business Combination or (ii) an offer to sell, a solicitation of an offer to buy or a recommendation to purchase any securities . No such offering of securities shall be made except by means of a prospectus meeting the requirements of section 10 of the Securities Act of 1933 , as amended (the “Securities Act”), or an exemption therefrom . You should not construe the contents of this Presentation as legal, tax, accounting, investment or other advice or a recommendation . You should consult your own counsel and tax and financial advisors as to legal and related matters concerning the matters described herein, and, by accepting this Presentation, you confirm that you are not relying upon the information contained herein to make any decision . The distribution of this Presentation may also be restricted by law and persons into whose possession this Presentation comes should inform themselves about, and observe, any such restrictions . The recipient acknowledges that it is (a) aware that the United States securities laws prohibit any person who has material, non - public information concerning a company from purchasing or selling securities of such company or from communicating such information to any other person under circumstances in which it is reasonably foreseeable that such person is likely to purchase or sell such securities, and (b) familiar with the Securities Exchange Act of 1934 , as amended, and the rules and regulations promulgated thereunder (collectively, the "Exchange Act"), and that the recipient will neither use, nor cause any third party to use, this Presentation or any information contained herein in contravention of the Exchange Act, including, without limitation, Rule 10 b - 5 thereunder . This Presentation and information contained herein constitutes confidential information and is provided to you on the condition that you agree that you will hold it in strict confidence and not reproduce, disclose, forward or distribute it in whole or in part without the prior written consent of SPAC and the Company and is intended for the recipient hereof only . By accepting this Presentation, the recipient agrees (a) to maintain the confidentiality of all information that is contained in this Presentation and not already in the public domain and (b) to return or destroy all copies of this Presentation or portions thereof in its possession upon request . This Presentation is being distributed to selected recipients only and is not intended for distribution to, or use by, any person or entity in any jurisdiction or country where such distribution or use would be contrary to local law or regulation . Neither this Presentation nor any part of it may be taken or transmitted into the United States or published, released, disclosed or distributed, directly or indirectly, in the United States, as that term is defined in the Securities Act, except to a limited number of qualified institutional buyers, as defined in Rule 144 A under the Securities Act, or institutional “accredited investors” within the meaning of Regulation D under the Securities Act . Important Additional Information and Where to Find It In connection with the proposed Business Combination, Galata and Marti intend to file a registration statement on Form F - 4 (the “Registration Statement”) with the U . S . Securities and Exchange Commission (“SEC”), which will include a proxy statement/prospectus and certain other related documents . INVESTORS AND SECURITY HOLDERS ARE URGED TO READ THE REGISTRATION STATEMENT, PROXY STATEMENT/PROSPECTUS, ANY AMENDMENTS OR SUPPLEMENTS THERETO AND ANY OTHER RELEVANT DOCUMENTS TO BE FILED WITH THE SEC IN CONNECTION WITH THE PROPOSED BUSINESS COMBINATION CAREFULLY AND IN THEIR ENTIRETY, WHEN THEY BECOME AVAILABLE, BECAUSE THEY WILL CONTAIN IMPORTANT INFORMATION ABOUT GALATA, MARTI AND THE PROPOSED BUSINESS COMBINATION . When available, the definitive proxy statement/prospectus and other relevant materials for the proposed Business Combination will be mailed to stockholders of Galata as of a record date to be established for voting on the proposed Business Combination . Security holders and investors will also be able to obtain copies of the Registration Statement, proxy statement/prospectus and other documents filed with the SEC that will be incorporated by reference therein, without charge, once available, at the SEC’s website at www . sec . gov . Documents filed with the SEC by Galata will also be available free of charge by accessing Galata’s website at https : //www . galatacorp . net, or, alternatively, by directing a request by mail to Galata at 2001 S Street NW, Suite 320 , Washington, DC 20009 . Participants in the Solicitation Galata and Marti and certain of their respective directors and executive officers and other members of management and employees may be deemed to be participants in the solicitation of proxies with respect to the proposed Business Combination under the rules of the SEC . Information about Galata’s directors and executive officers is contained in Galata’s Annual Report on Form 10 - K for the fiscal year ended December 31 , 2021 , as filed with the SEC pursuant to Section 13 of the Exchange Act, as amended, on March 31 , 2022 , which is available free of charge at the SEC’s website at www . sec . gov or by directing a request to Galata at 2001 S Street NW, Suite 320 , Washington, DC 20009 . Additional information regarding the participants in the proxy solicitation and a description of their direct and indirect interests, by security holdings or otherwise, will be contained in the proxy statement/prospectus and other relevant materials to be filed with the SEC regarding the proposed Business Combination when they become available . Investors should read the proxy statement/prospectus carefully when it becomes available before making any voting or investment decisions . You may obtain free copies of these documents from the sources indicated above . Disclaimers 2
Cautionary Statement Regarding Forward - Looking Information T his Presentation contains statements that are not based on historical fact and are “forward - looking statements’’ within the meaning of the “safe harbor” provisions of the Private Securities Litigation Reform Act of 1995 . For example, statements about the expected timing of the completion of the Business Combination, the benefits of the Business Combination, the competitive environment, and the expected future performance and market opportunities of Marti are forward - looking statements . In some cases, you can identify forward looking statements by terminology such as, or which contain the words “will,” “aim,” “anticipate,” “believe,” “continue,” “could,” “estimate,” “expect,” “forecast,” “future,” “intend,” “may,” “plan,” “possible,” “predict,” “project,” “seek,” “should,” “target,” “will,” “would” and variations of these words or similar expressions . Such forward - looking statements are subject to risks, uncertainties and other factors . Actual results may differ materially from the expectations expressed or implied in the forward - looking statements as a result of known and unknown risks and uncertainties . These forward - looking statements are based on estimates and assumptions that, while considered reasonable by Galata and its management and Marti and its management, as the case may be, are inherently uncertain and are subject to a number of risks and assumptions . These statements are not guarantees of future performance and are subject to risks, uncertainties and other factors, some of which are beyond Galata’s and Marti’s control, are difficult to predict, and could cause actual results to differ materially from those expressed or forecasted in the forward - looking statements . Known risks and uncertainties include but are not limited to : ( 1 ) the occurrence of any event, change or other circumstances that could give rise to the termination of the Business Combination agreement ; ( 2 ) the outcome of any legal proceedings that may be instituted against Marti, Galata, the combined company or others following the announcement of the proposed Business Combination ; ( 3 ) the inability to complete the proposed Business Combination in a timely manner or at all (including due to the failure to obtain approval of the stockholders of Galata or to satisfy other conditions to closing) ; ( 4 ) changes to the proposed structure of the proposed Business Combination that may be required or appropriate as a result of applicable laws or regulations ; ( 5 ) the ability to meet applicable stock exchange listing standards at or following the consummation of the proposed Business Combination ; ( 6 ) the risk that the proposed Business Combination disrupts current plans and operations of Marti as a result of the announcement and consummation of the proposed Business Combination ; ( 7 ) the ability to recognize the anticipated benefits of the proposed Business Combination, which may be affected by, among other things, competition, the ability of the combined company to grow and manage growth profitably, maintain relationships with customers and suppliers and retain its management and key employees ; ( 8 ) costs related to the proposed Business Combination, including the amount of cash available following any redemptions by Galata stockholders ; ( 9 ) changes in applicable laws or regulations ; ( 10 ) the possibility that Marti or the combined company may be adversely affected by other economic, business and/or competitive factors ; ( 11 ) risks relating to Marti’s operating history and the mobile transportation industry ; ( 12 ) risks associated with doing business in an emerging market ; ( 13 ) risks relating to Marti’s dependence on and use of certain intellectual property and technology ; and ( 14 ) other risks and uncertainties set forth in the Registration Statement to be filed by Galata with the SEC in connection with the proposed Business Combination . The foregoing list of important factors is not exhaustive and you should carefully consider the other risks and uncertainties described in the “Risk Factors” section of Galata’s Annual Report on Form 10 - K, Quarterly Reports on Form 10 - Q and other documents filed by Galata from time to time with the SEC . Nothing herein should be regarded as a representation by any person that the forward - looking statements set forth herein will be achieved or that any of the contemplated results of such forward - looking statements will be achieved . You should not place undue reliance on forward - looking statements, which speak only as of the date they are made . Except as may be required by applicable law, neither Marti nor Galata undertakes any duty to update or revise any forward - looking statements whether as a result of new information, new events, future events or circumstances, or otherwise . Use of Projections This Presentation contains financial forecasts for the Company with respect to certain financial results for the Company’s fiscal years 2022 through 2023 . The Company’s independent auditors have not audited, studied, reviewed, compiled or performed any procedures with respect to the projections for the purpose of their inclusion in this Presentation, and accordingly, they did not express an opinion or provide any other form of assurance with respect thereto for the purpose of this Presentation . These projections are forward - looking statements and should not be relied upon as being necessarily indicative of future results . In this Presentation, certain of the above - mentioned projected information has been provided for purposes of providing comparisons with historical data . The assumptions and estimates underlying the prospective financial information are inherently uncertain and are subject to a wide variety of significant business, economic, competitive and other risks and uncertainties that could cause actual results to differ materially from those contained in the prospective financial information . Accordingly, there can be no assurance that the prospective results are indicative of the future performance of the Company or that actual results will not differ materially from those presented in the prospective financial information . Inclusion of the prospective financial information in this Presentation should not be regarded as a representation by any person that the results contained in the prospective financial information will be achieved . The performance projections and estimates are subject to the ongoing COVID - 19 pandemic and have the potential to be revised to take into account further adverse effects of the COVID - 19 pandemic on the future performance of SPAC and Marti . Projected financial results and estimates are based on an assumption that public health, economic, market and other conditions will improve ; however, there can be no assurance that such conditions will improve within the time period or to the extent estimated by SPAC or Marti . The full impact of the COVID - 19 pandemic on future performance is particularly uncertain and difficult to predict ; therefore actual results may vary materially and adversely from the projections included herein . Disclaimers (cont’d) 3
Financial Information ; Non - GAAP Measures The financial information and data contained in this Presentation is unaudited and does not conform to Regulation S - X promulgated under the Securities Act . Such information and data may not be included in, may be adjusted in or may be presented differently in, the registration statement on Form F - 4 to be filed relating to the Business Combination and the proxy statement/prospectus contained therein . This Presentation also includes certain financial measures not presented in accordance with generally accepted accounting principles of the United States (“GAAP”) including, but not limited to, Adjusted EBITDA and certain ratios and other metrics derived therefrom . The Company defines Adjusted EBITDA as net income (loss) plus non - operating income (loss), depreciation and amortization, net interest expense, income taxes, stock - based compensation and transaction costs . These non - GAAP financial measures are not measures of financial performance in accordance with GAAP and may exclude items that are significant in understanding and assessing the Company’s financial results . Therefore, these measures should not be considered in isolation or as an alternative to net income, cash flows from operations or other measures of profitability, liquidity or performance under GAAP . You should be aware that the Company’s presentation of these measures may not be comparable to similarly - titled measures used by other companies . The Company believes these non - GAAP measures of financial results provide useful information for management and investors regarding certain financial and business trends relating to the Company’s financial condition and results of operations . The Company believes the use of these non - GAAP financial measures provides an additional tool for investors to use in evaluating ongoing operating results and trends and in comparing the Company’s financial measures with other similar companies, many of which present similar non - GAAP financial measures to investors . These non - GAAP financial measures are subject to inherent limitations as they reflect the exercise of judgments by management about which expense and income are excluded or included in determining these non - GAAP financial measures . This Presentation also includes certain projections of non - GAAP financial measures . Due to the high variability and difficulty in making accurate forecasts and projections of some of the information excluded from these projected measures, together with some of the excluded information not being ascertainable or accessible, the Company is unable to quantify certain amounts that would be required to be included in the most directly comparable GAAP financial measures without unreasonable effort . Consequently, no disclosure of estimated comparable GAAP measures is included and no reconciliation of the forward - looking non - GAAP financial measures is included . Industry and Market Data In this Presentation, SPAC and the Company rely on and refer to certain information and statistics obtained from third - party sources which SPAC and the Company believe to be reliable . While SPAC and the Company believe such third - party information is reliable, there can be no assurance as to the accuracy or completeness of the indicated information, and the Company has not independently verified the accuracy or completeness of any such information . Trademarks This Presentation contains trademarks, service marks, trade names and copyrights of other companies, which are the property of their respective owners . The Company’s use thereof does not imply an affiliation with, or endorsement by, the owners of such trademarks, service marks, trade names and copyrights . Solely for convenience, some of the trademarks, service marks, trade names and copyrights referred to in this Presentation may be listed without the TM, SM © or ® symbols, but the Company will assert, to the fullest extent under applicable law, the rights of the applicable owners to these trademarks, service marks, trade names and copyrights . There is no guarantee that either SPAC or the Company will work, or continue to work, with any of the firms or businesses whose logos are included herein in the future . Disclaimers (cont’d) 4
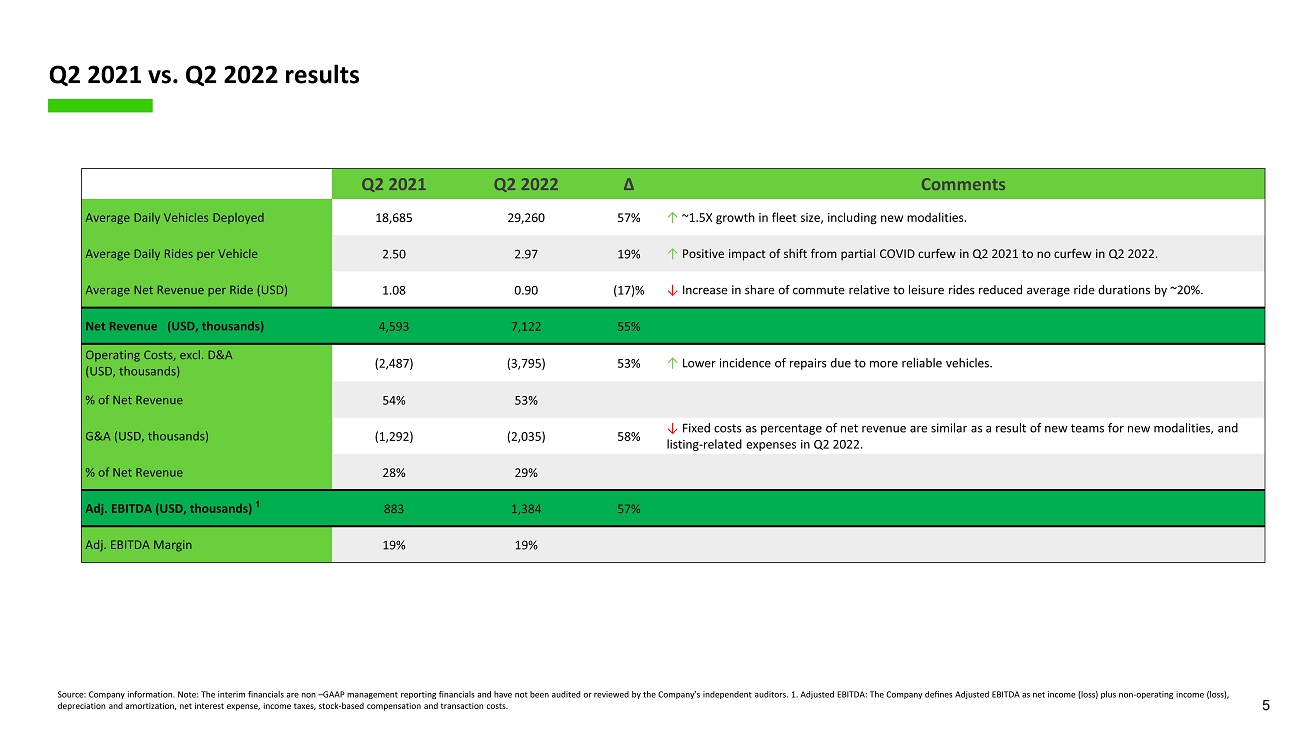
5 Q 2 2021 Q 2 202 2 ∆ Comments Average Daily Vehicles Deployed 18,685 29,260 57 % ↑ ~1. 5 X growth in fleet size, including new modalities . Average Daily Rides per Vehicle 2 .50 2.97 19 % ↑ Positive impact of shift from partial COVID curfew in Q2 2021 to no curfew in Q2 2022. Average Net Revenue per Ride (USD) 1.0 8 0.90 (17) % ↓ Increase in share of commute relative to leisure rides reduced average ride durations by ~20%. Net Revenue (USD, thousands ) 4,593 7,122 55% Operating Costs, excl. D&A (USD, thousands ) (2,487) (3,79 5 ) 53% ↓ Lower incidence of repairs due to more reliable vehicles . % of Net Revenue 54% 53% G&A (USD, thousands ) (1,2 92 ) ( 2,035 ) 5 8 % ↓ F ixed costs as percentage of net revenue are similar as a result of new teams for new modalities, and listing - related expenses in Q2 2022 . % of Net Revenue 28% 2 9 % Adj. EBITDA (USD, thousands ) 1 883 1,384 57 % Adj. EBITDA Margin 19% 19 % Q2 202 1 vs. Q2 202 2 results Source: Company information. Note : The interim financials are non – GAAP management reporting financials and have not been audited or reviewed by the Company’s independent auditors . 1. Adjusted EBITDA: The Company defines Adjusted EBITDA as net income (loss) plus non - operating income (loss), depreciation and amortization, net interest expense, income taxes, stock - based compensation and transaction costs .
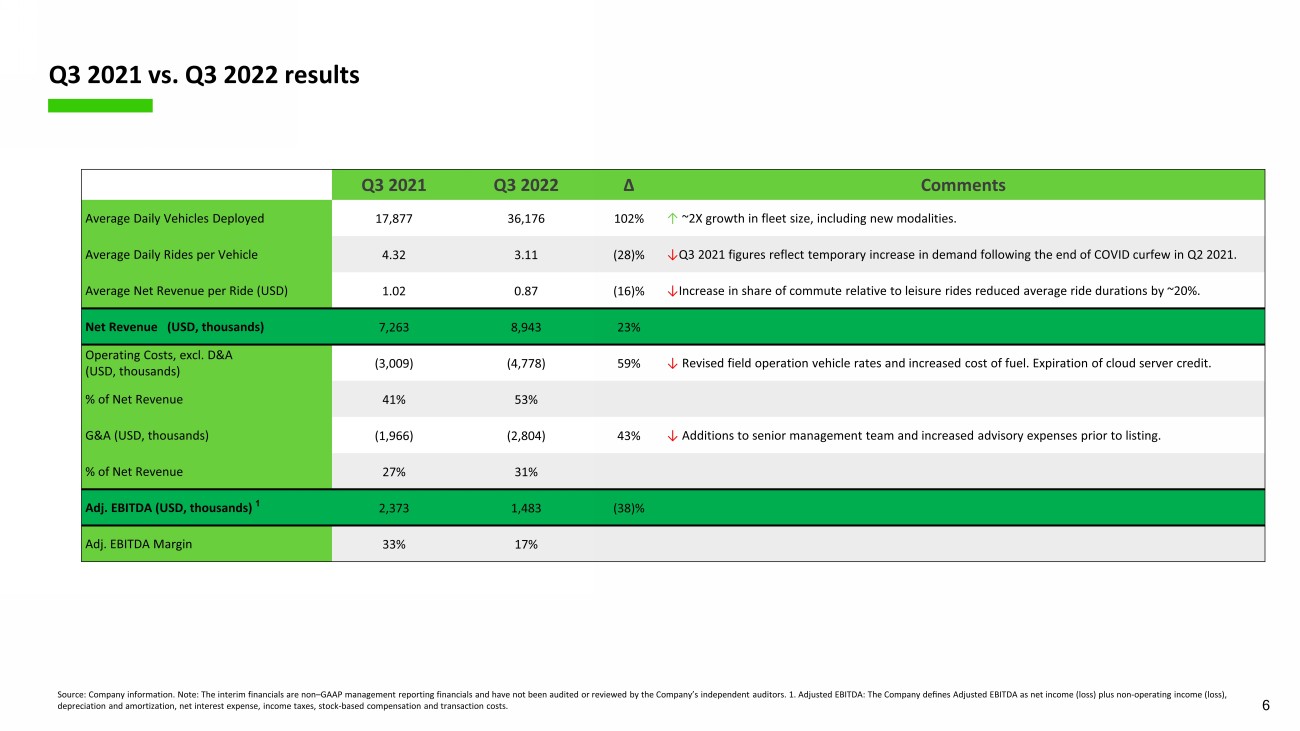
6 Q 3 2021 Q 3 202 2 ∆ Comments Average Daily Vehicles Deployed 17,877 36,176 102% ↑ ~ 2 X growth in fleet size, including new modalities . Average Daily Rides per Vehicle 4.32 3.11 (28)% ↓ Q3 2021 figures reflect temporary increase in demand following the end of COVID curfew in Q2 202 1 . Average Net Revenue per Ride (USD) 1.02 0.87 (16)% ↓ Increase in share of commute relative to leisure rides reduced average ride durations by ~20%. Net Revenue (USD, thousands ) 7,263 8,943 23% Operating Costs, excl. D&A (USD, thousands ) (3,009) (4,778) 59% ↓ Revised field operation vehicle rates and increased cost of fuel . Expiration of cloud server credit . % of Net Revenue 41% 53% G&A (USD, thousands ) (1,966) (2,804) 43% ↓ Additions to senior management team and increased advisory expenses prior to listing . % of Net Revenue 27% 31% Adj. EBITDA (USD, thousands ) 1 2,373 1,483 (38)% Adj. EBITDA Margin 33% 17% Q 3 202 1 vs. Q 3 202 2 results Source: Company information. Note : The interim financials are non – GAAP management reporting financials and have not been audited or reviewed by the Company’s independent auditors . 1. Adjusted EBITDA: The Company defines Adjusted EBITDA as net income (loss) plus non - operating income (loss), depreciation and amortization, net interest expense, income taxes, stock - based compensation and transaction costs .
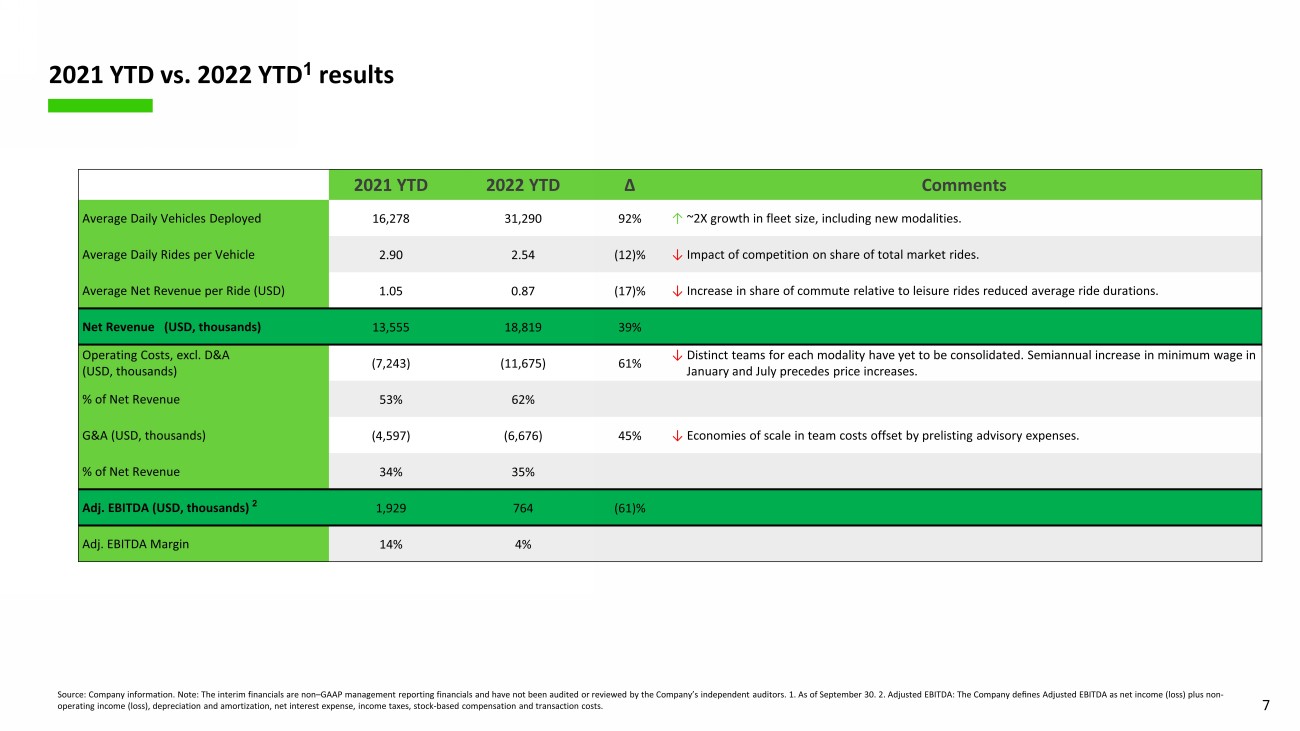
7 2021 YTD 2022 YTD ∆ Comments Average Daily Vehicles Deployed 16,278 31,290 92% ↑ ~ 2 X growth in fleet size, including new modalities . Average Daily Rides per Vehicle 2.90 2.54 (12)% ↓ Impact of competition on share of total market rides . Average Net Revenue per Ride (USD) 1.05 0.87 (17)% ↓ Increase in share of commute relative to leisure rides reduced average ride durations. Net Revenue (USD, thousands ) 13,555 18,819 39% Operating Costs, excl. D&A (USD, thousands ) (7,243) (11,675) 61% ↓ Distinct teams for each modality have yet to be consolidated. Semiannual increase in minimum wage in January and July precedes price increases . % of Net Revenue 53% 62% G&A (USD, thousands ) (4,597) (6,676) 45% ↓ Economies of scale in team costs offset by prelisting advisory expenses. % of Net Revenue 34% 35% Adj. EBITDA (USD, thousands ) 2 1,929 764 (61)% Adj. EBITDA Margin 14% 4% 202 1 YTD vs. 202 2 YTD 1 results Source: Company information. Note : The interim financials are non – GAAP management reporting financials and have not been audited or reviewed by the Company’s independent auditors . 1. As of September 30. 2. A djusted EBITDA: The Company defines Adjusted EBITDA as net income (loss) plus non - operating income (loss), depreciation and amortization, net interest expense, income taxes, stock - based compensation and transac tion costs .
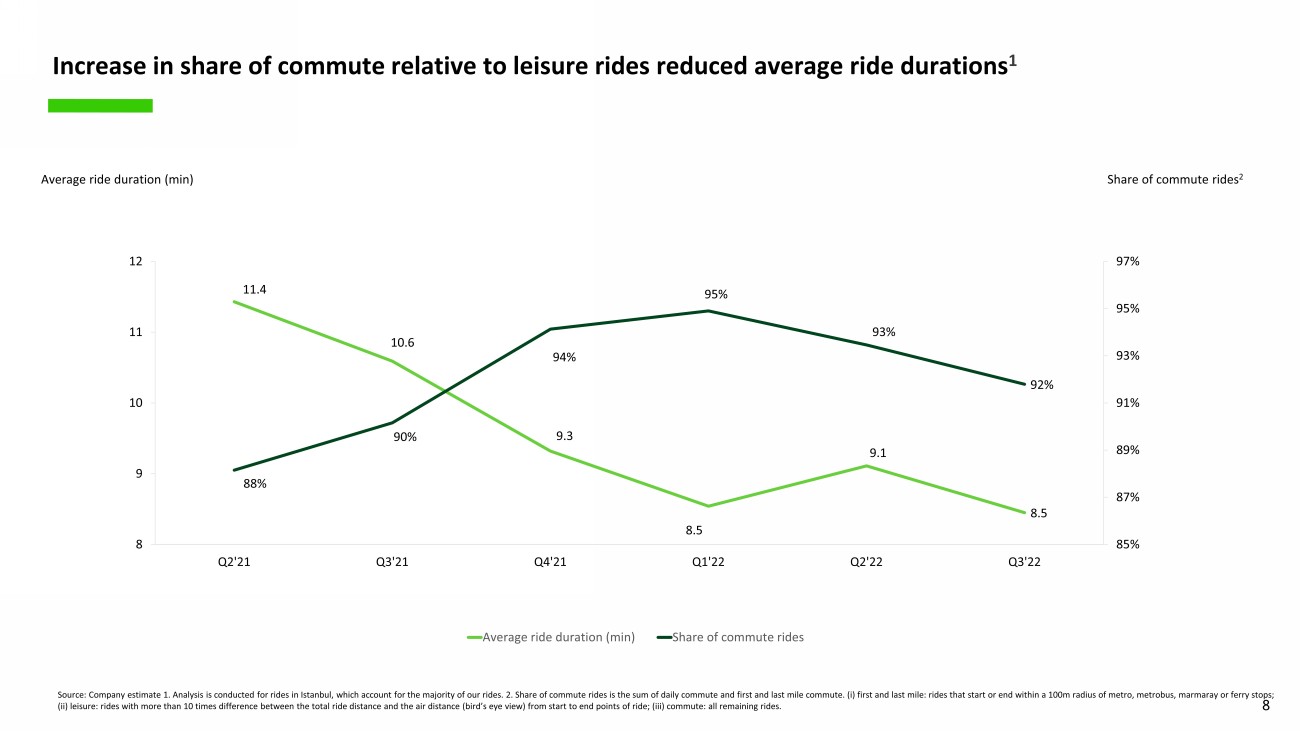
8 Increase in share of commute relative to leisure rides reduced average ride durations 1 Average ride duration ( min ) Share of commute rides 2 Source: Company estimate 1. Analysis is conducted for rides in Istanbul, which account for the majority of our rides . 2. Share of commute rides is the sum of daily commute and first and last mile commute. ( i ) first and last mile: rides that start or end with in a 100m radius of metro, metrobus, marmaray or ferry stops; (ii) leisure: r ides with more than 10 times difference between the total ride distance and the air distance (bird’s eye view) from start to end points of ride ; (iii) commute: all remaining rides. 11.4 10.6 9.3 8.5 9.1 8.5 88% 90% 94% 95% 93% 92% 85% 87% 89% 91% 93% 95% 97% 8 9 10 11 12 Q2'21 Q3'21 Q4'21 Q1'22 Q2'22 Q3'22 Average ride duration (min) Share of commute rides
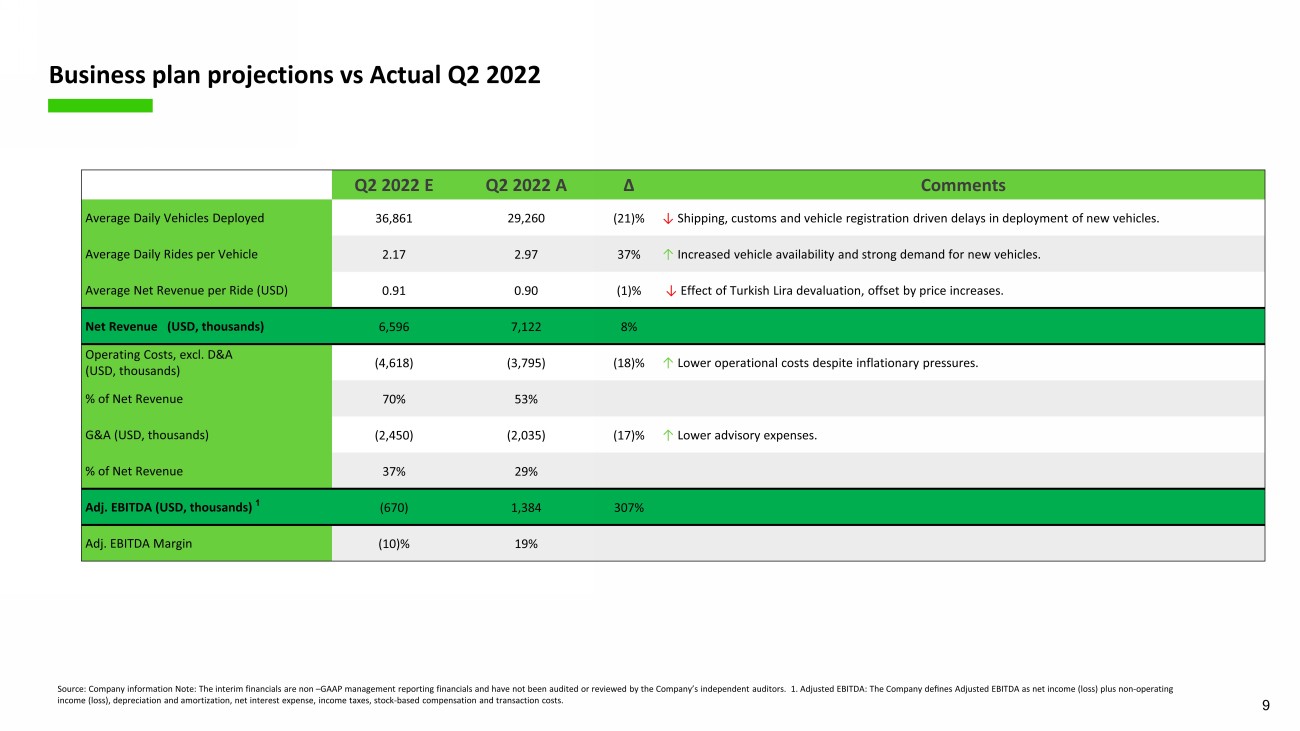
9 Q 2 2022 E Q 2 202 2 A ∆ Comments Average Daily Vehicles Deployed 36,861 29,260 (21) % ↓ Shipping , customs and vehicle registration driven delays in deployment of new vehicles . Average Daily Rides per Vehicle 2. 17 2.97 37 % ↑ Increased vehicle availability and strong demand for new vehicles . Average Net Revenue per Ride (USD) 0. 91 0.90 (1) % ↓ Effect of Turkish Lira devaluation , offset by price increases . Net Revenue (USD, thousands ) 6,596 7,122 8 % Operating Costs, excl. D&A (USD, thousands ) ( 4,618 ) (3,79 5 ) (18) % ↑ Lower operational costs despite inflationary pressures. % of Net Revenue 70 % 53% G&A (USD, thousands ) (2,450 ) ( 2,035 ) (17) % ↑ Lower advisory expenses . % of Net Revenue 3 7% 2 9 % Adj. EBITDA (USD, thousands ) 1 ( 670 ) 1,384 307 % Adj. EBITDA Margin (10) % 19 % B usiness plan projections vs Actual Q2 2022 Source: Company information Note : The interim financials are non – GAAP management reporting financials and have not been audited or reviewed by the Company’s independent auditors . 1. Adjusted EBITDA: The Company defines Adjusted EBITDA as net income (loss) plus non - operating income (loss), depreciation and amortization, net interest expense, income taxes, stock - based compensation and transaction costs .
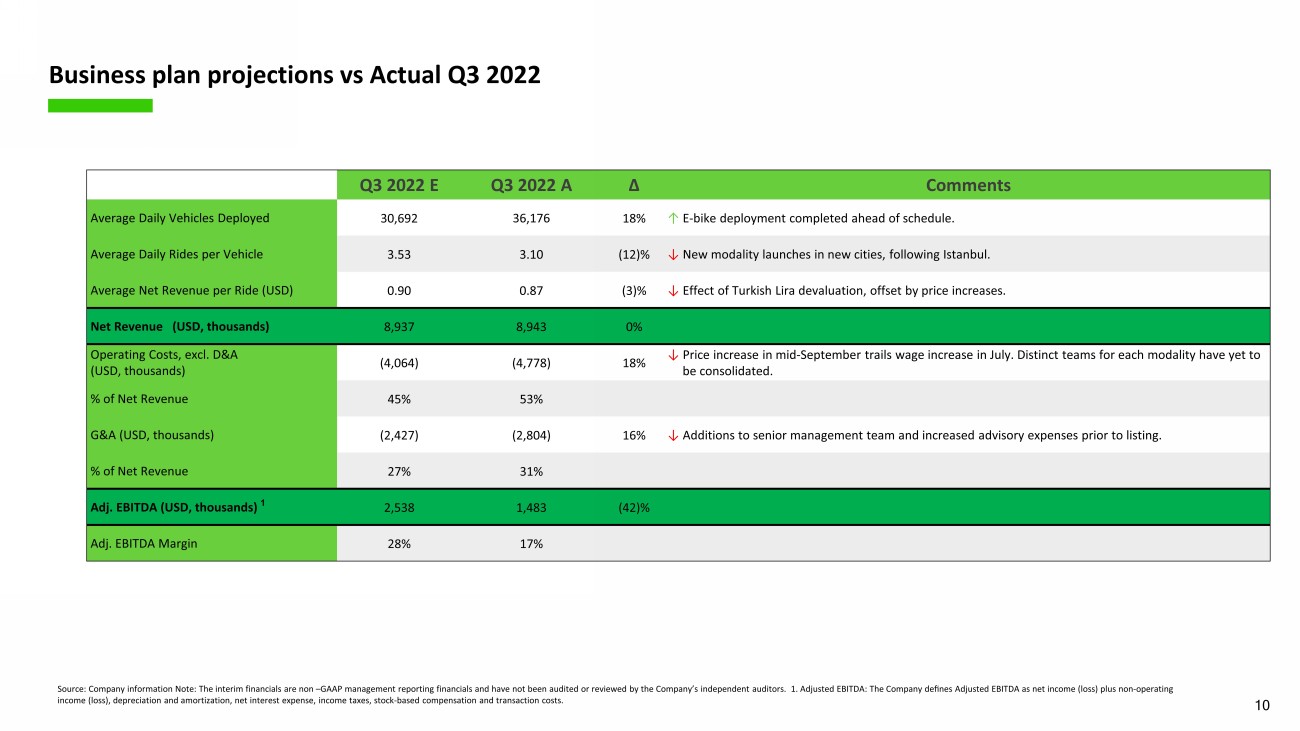
10 Q 3 2022 E Q 3 202 2 A ∆ Comments Average Daily Vehicles Deployed 30,692 36,176 18% ↑ E - bike deployment c ompleted ahead of schedule. Average Daily Rides per Vehicle 3.53 3.10 (12)% ↓ New modality launches in new cities , following Istanbu l. Average Net Revenue per Ride (USD) 0.90 0.87 (3)% ↓ Effect of Turkish Lira devaluation , offset by price increases . Net Revenue (USD, thousands ) 8,937 8,943 0% Operating Costs, excl. D&A (USD, thousands ) (4,064) (4,778) 18% ↓ Price increase in mid - September trails wage increase in July. Distinct teams for each modality have yet to be consolidated . % of Net Revenue 45% 53% G&A (USD, thousands ) (2,427) (2,804) 16% ↓ Additions to senior management team and increased advisory expenses prior to listing . % of Net Revenue 27% 31% Adj. EBITDA (USD, thousands ) 1 2,538 1,483 (42)% Adj. EBITDA Margin 28% 17% B usiness plan projections vs Actual Q 3 2022 Source: Company information Note : The interim financials are non – GAAP management reporting financials and have not been audited or reviewed by the Company’s independent auditors . 1. Adjusted EBITDA: The Company defines Adjusted EBITDA as net income (loss) plus non - operating income (loss), depreciation and amortization, net interest expense, income taxes, stock - based compensation and transaction costs .
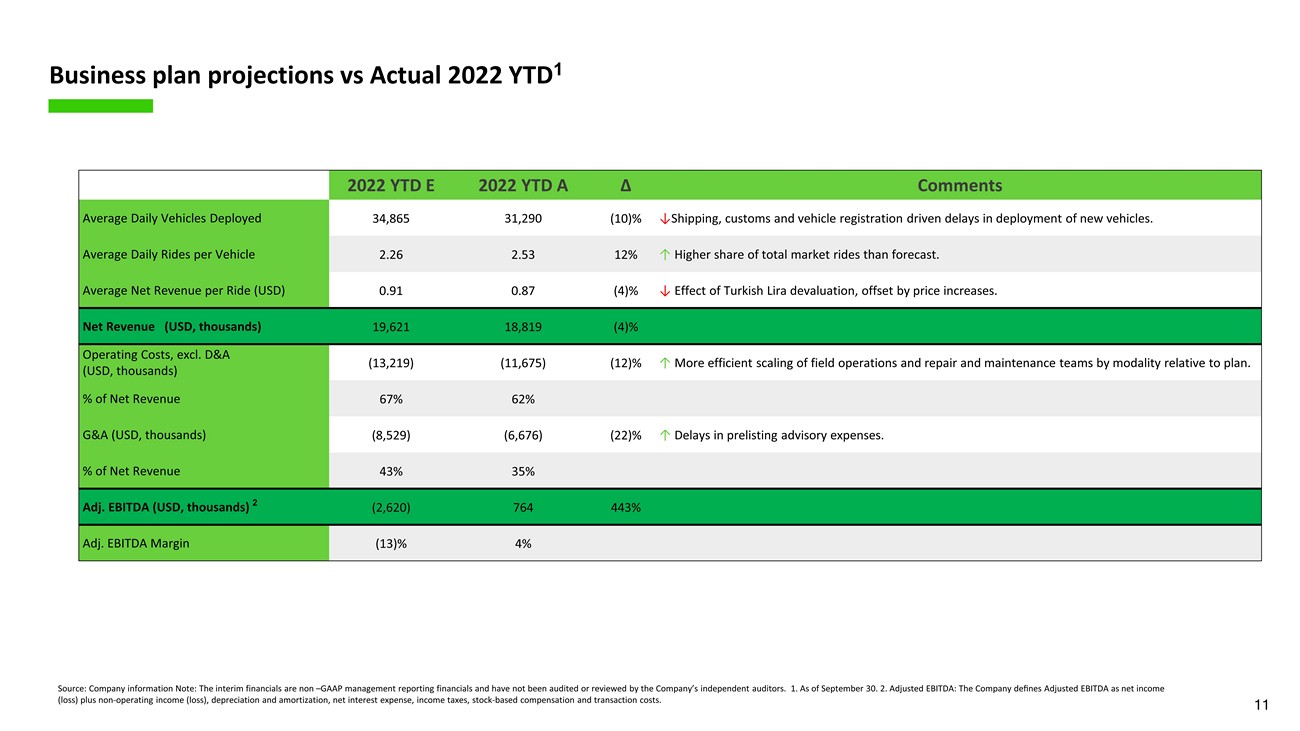
11 2022 YTD E 202 2 YTD A ∆ Comments Average Daily Vehicles Deployed 34,865 31,290 (10)% ↓ Shipping , customs and vehicle registration driven delays in deployment of new vehicles . Average Daily Rides per Vehicle 2.26 2.53 12% ↑ Higher share of total market rides than forecast . Average Net Revenue per Ride (USD) 0.91 0.87 (4)% ↓ Effect of Turkish Lira devaluation , offset by price increases . Net Revenue (USD, thousands ) 19,621 18,819 (4)% Operating Costs, excl. D&A (USD, thousands ) (13,219) (11,675) (12)% ↑ More efficient scaling of field operations and repair and maintenance teams by modality relative to plan. % of Net Revenue 67% 62% G&A (USD, thousands ) (8,529) (6,676) (22)% ↑ Delays in prelisting advisory expenses . % of Net Revenue 43% 35% Adj. EBITDA (USD, thousands ) 2 (2,620) 764 443% Adj. EBITDA Margin 28% 17% B usiness plan projections vs Actual 2022 YTD 1 Source: Company information Note : The interim financials are non – GAAP management reporting financials and have not been audited or reviewed by the Company’s independent auditors . 1. As of September 30. 2. Adjusted EBITDA: The Company defines Adjusted EBITDA as net income (loss) plus non - operating income (loss), depreciation and amortization, net interest expense, income taxes, stock - based compensa tion and transaction costs .
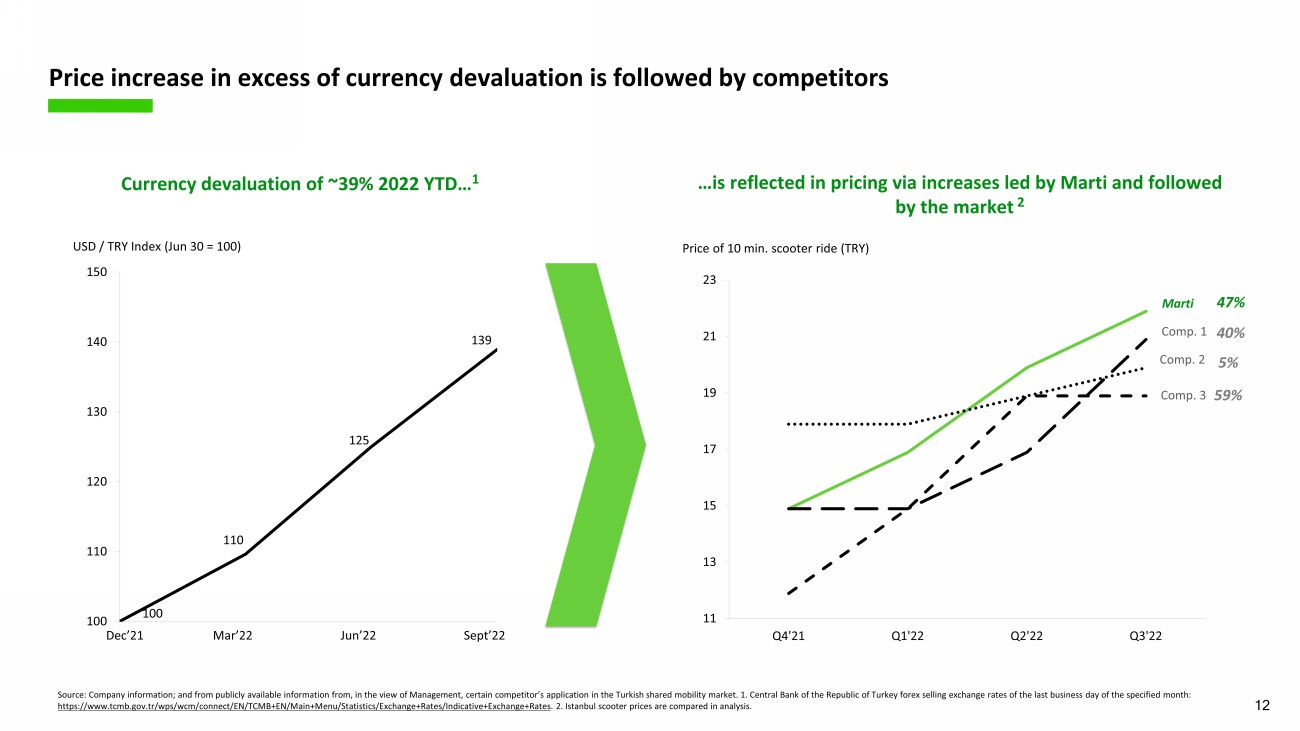
12 Price increase in excess of currency devaluation is followed by competitors Price of 10 min. scooter ride (TRY) Marti Comp. 1 Comp . 2 Comp . 3 Currency devaluation of ~ 39 % 2022 YTD … 1 125 139 100 110 120 130 140 150 110 Jun’22 USD / TRY Index ( Jun 30 = 100) Sept’22 100 Dec’21 Mar’22 40 % 47 % 5 % 59 % …is reflected in pricing via increases led by Marti and followed by the market 2 Source: Company information ; and from publicly available information from , in the view of Management, certain competitor’s application in the Turkish shared mobility market. 1. Central Bank of the Republic of Turkey forex selling exchange rates of the last business day of the specified month : https://www.tcmb.gov.tr/wps/wcm/connect/EN/TCMB+EN/Main+Menu/Statistics/Exchange+Rates/Indicative+Exchange+Rates . 2. Istanbul scooter prices are compared in analysis. 11 13 15 17 19 21 23 Q4'21 Q1'22 Q2'22 Q3'22
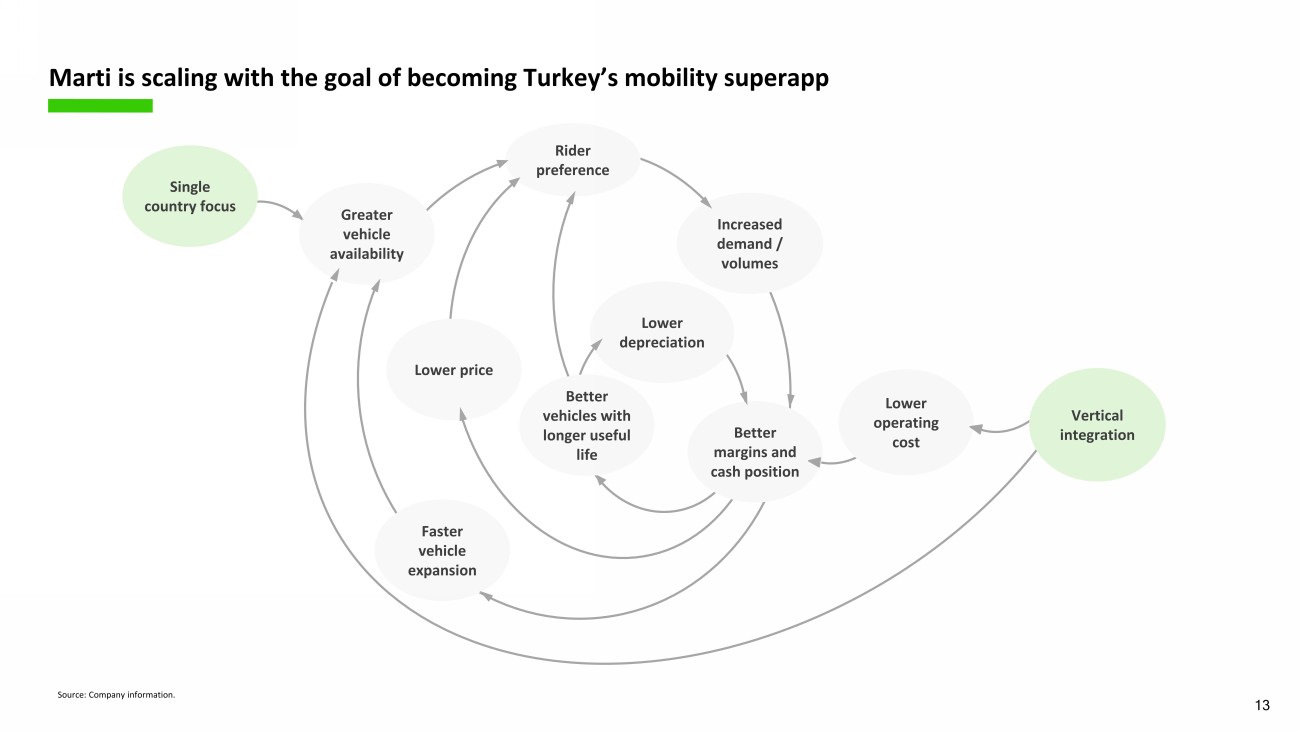
Lower depreciation Single country focus Greater vehicle availability Lower operating cost Rider preference Increased demand / volumes Lower price Better margins and cash position Faster vehicle expansion Better vehicles with longer useful life Vertical integration 13 Marti is scaling with the goal of becoming Turkey’s mobility superapp Source: Company information.
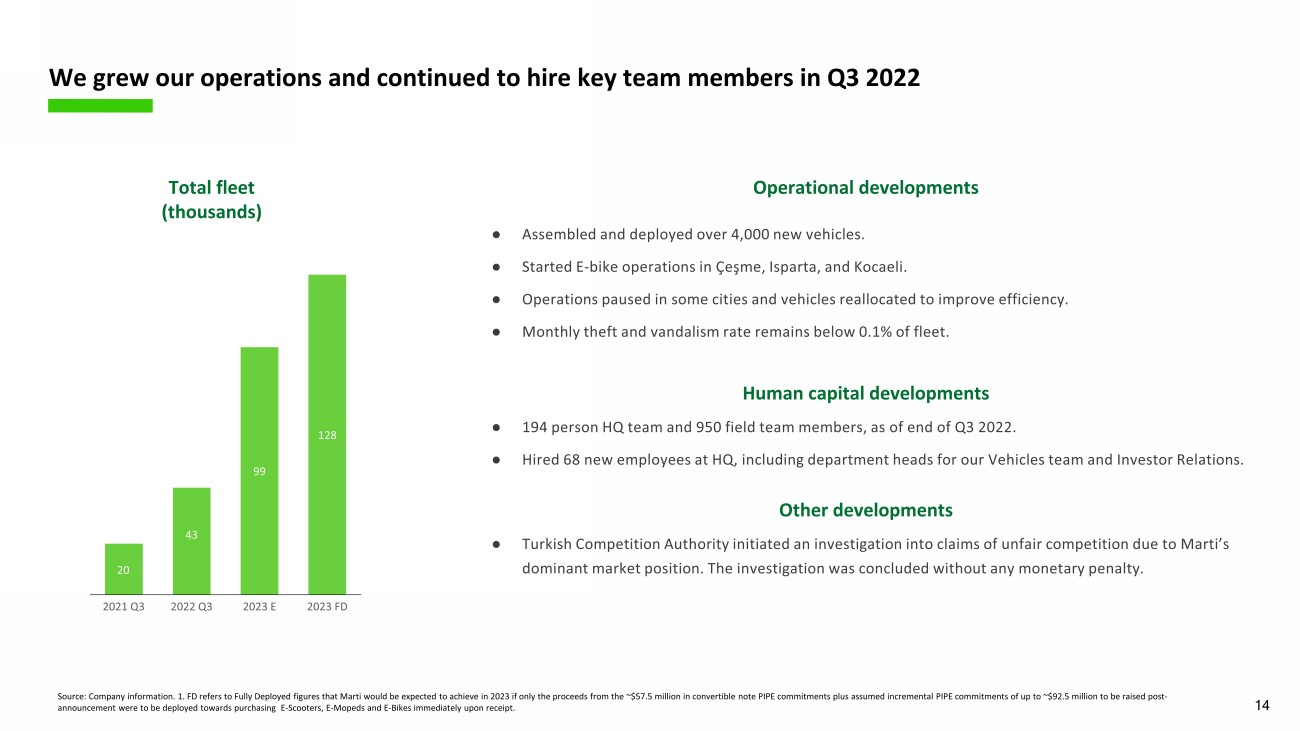
14 We grew our operations and continued to hire key team members in Q 3 2022 ● Assembled and deployed over 4,000 new vehicles . ● Started E - bike operations in Çeşme, Isparta, and Kocaeli. ● Operations paused in some cities and vehicles reallocated to improve efficiency . ● M onthly theft and vandalism rate remains below 0.1% of fleet . ● 1 94 person HQ team and 9 50 field team members, as of end of Q 3 2022. ● Hired 68 new employees at HQ , including department heads for our Vehicles team and Investor Relations . Human capital developments Operational developments 20 43 99 128 2022 Q3 2021 Q3 2023 E 2023 FD Total fleet ( thousands ) Other developments ● Turkish Competition Authority initiated an investigation into claims of unfair competition due to Marti’s dominant market position. The investigation was concluded without any monetary penalty . Source: Company information. 1. FD refers to Fully Deployed figures that Marti would be expected to achieve in 2023 if only the proceeds from the ~$57.5 mill ion in convertible note PIPE commitments plus assumed incremental PIPE commitments of up to ~$92.5 million to be raised post - announcement were to be deployed towards purchasing E - Scooters, E - Mopeds and E - Bikes immediately upon receipt .
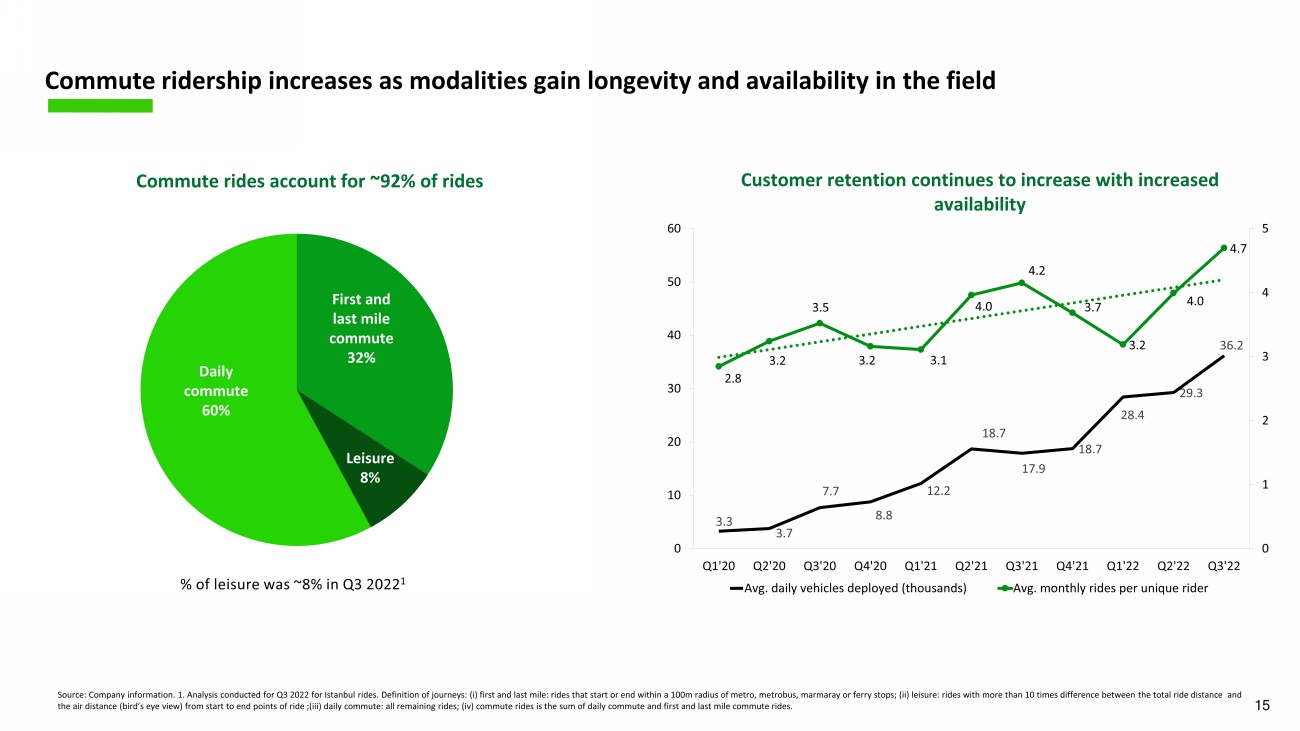
Customer retention continues to increase with increased availability Commute rides account for ~9 2 % of rides % of leisure was ~ 8 % in Q 3 2022 1 Commute ridership increases as modalities gain longevity and availability in the field 15 Daily commute 6 0 % First and last mile commute 3 2 % Leisure 8 % 3.3 3.7 7.7 8.8 12.2 18.7 17.9 18.7 28.4 29.3 36.2 2.8 3.2 3.5 3.2 3.1 4.0 4.2 3.7 3.2 4.0 4.7 0 1 2 3 4 5 0 10 20 30 40 50 60 Q1'20 Q2'20 Q3'20 Q4'20 Q1'21 Q2'21 Q3'21 Q4'21 Q1'22 Q2'22 Q3'22 Avg. daily vehicles deployed (thousands) Avg. monthly rides per unique rider Source: Company information. 1. Analysis conducted for Q 3 2022 for Istanbul rides. Definition of journeys : (i) first and last mile: rides that start or end with in a 100m radius of metro, metrobus, m armara y or ferry stops; (ii) leisure: r ides with more than 10 times difference between the total ride distance and the air distance (bird’s eye view) from start to end points of ride ; (iii) daily c ommute : all remaining rides ; (iv) commute rides is the sum of daily commute and first and last mile commute rides .
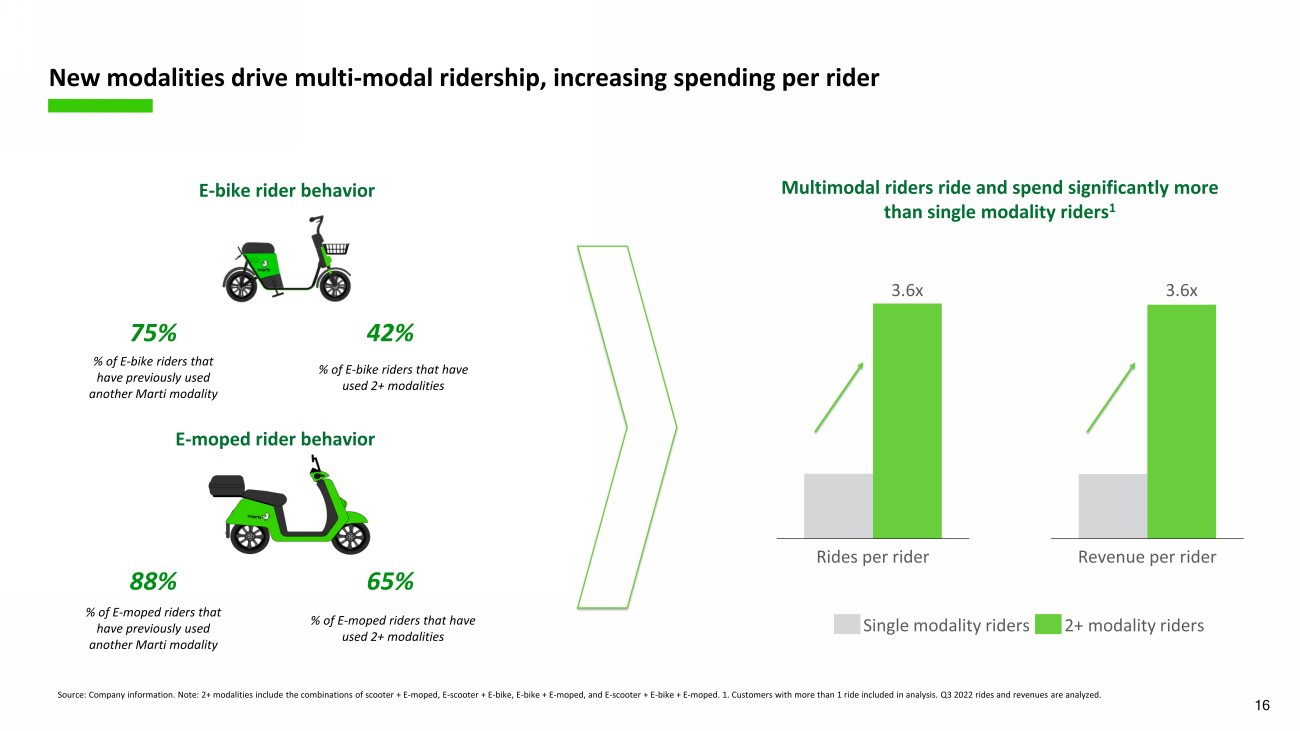
16 E - bike rider behavior % of E - bike riders that have used 2+ modalities % of E - bike riders that have previously used another Marti modality 42 % 75 % E - moped rider behavior % of E - moped riders that have previously used another Marti modality 65 % 88 % % of E - moped riders that have used 2+ modalities Multimodal riders ride and spend significantly more than single modality riders 1 Revenue per rider 3. 6 x Rides per rider 3 .6x Single modality riders 2+ modality riders New modalities drive multi - modal ridership, increasing spending per rider Source: Company information . Note: 2+ modalities include the combination s of scooter + E - moped, E - scooter + E - bike, E - bike + E - moped, and E - scooter + E - bike + E - moped. 1 . Customers with more than 1 ride included in analysis. Q 3 2022 rides and revenues are analyzed.
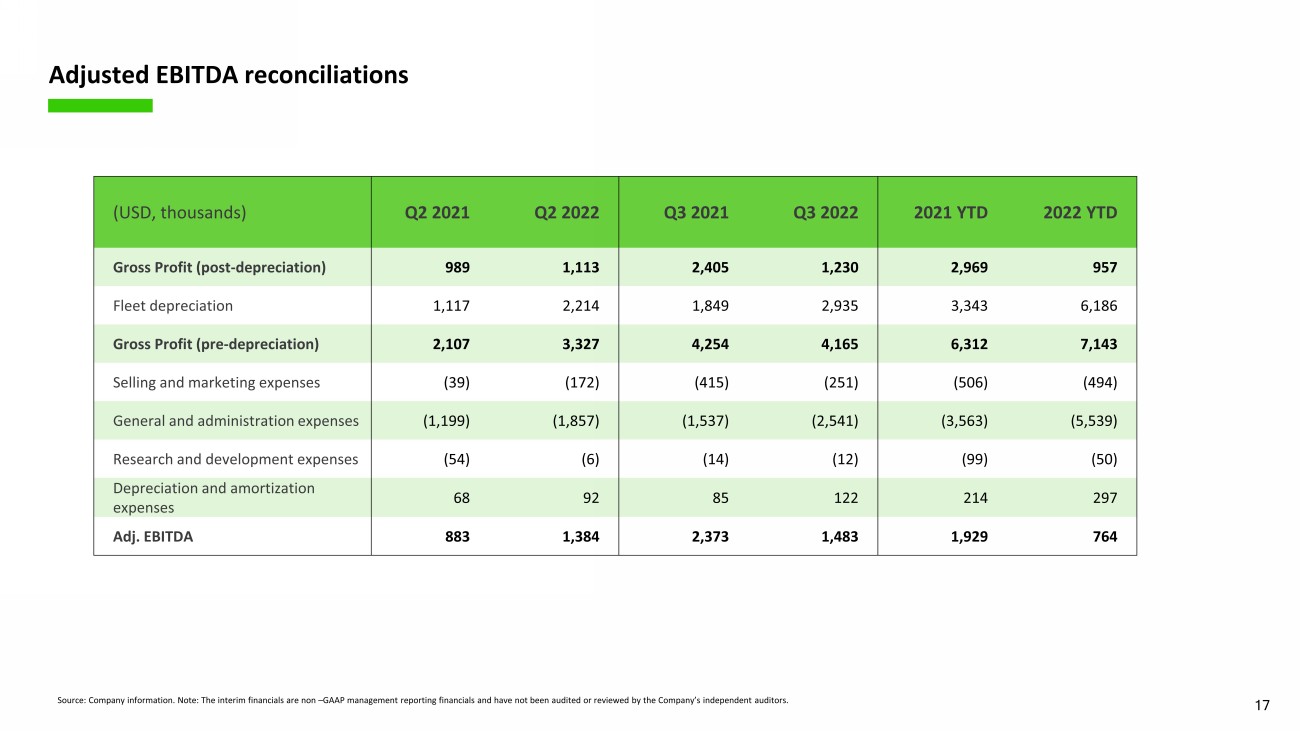
17 Adjusted EBITDA reconciliations Source: Company information. Note : The interim financials are non – GAAP management reporting financials and have not been audited or reviewed by the Company’s independent auditors . ( USD, thousands ) Q2 2021 Q2 2022 Q3 2021 Q3 2022 2021 YTD 2022 YTD Gross Profit (post - depreciation) 989 1,113 2,405 1,230 2,969 957 Fleet d epreciation 1,117 2,214 1,849 2,935 3,343 6,186 Gross Profit (pre - depreciation) 2,107 3,327 4,254 4,165 6,312 7,143 Selling and marketing expenses ( 39 ) (172) (415) (251) (506) (494) General and administration expenses ( 1,199 ) ( 1,857 ) (1,537) (2,541) (3,563) (5,539) Research and development expenses (5 4 ) ( 6 ) (14) (12) (99) (50) Depreciation and a morti z ation e xpenses 68 92 85 122 214 297 Adj . EBITDA 883 1,384 2,373 1,483 1,929 764

18 Q&A